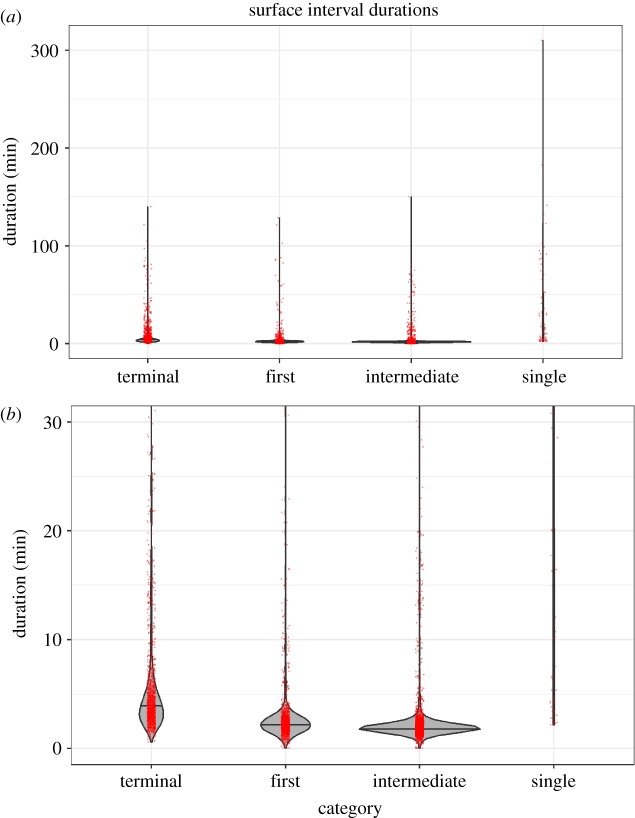
Figure 6.
(a) Violin plot of all surface interval durations for Cuvier's beaked whales off Cape Hatteras by type, including outliers. (b) Violin plot of surface interval durations, cut-off at 30 min duration to improve readability of the plot. Violin plots show the distribution of points. Red dots are actual data points and are jittered for clarity.

