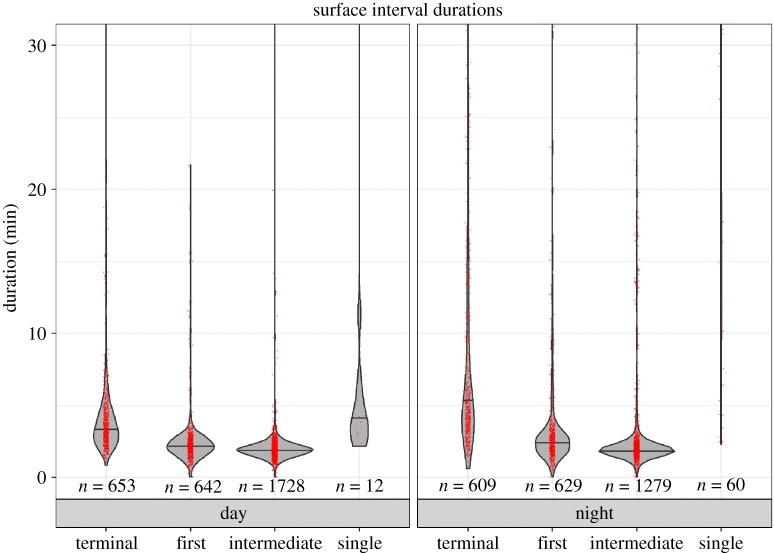
Figure 8.
Violin plot of surface interval durations by category, split by time of day for Cuvier's beaked whales off Cape Hatteras. Violin plot shows distributions of data points. Red dots are actual data points, jittered for clarity. The number of observations in each category is given below each violin.

