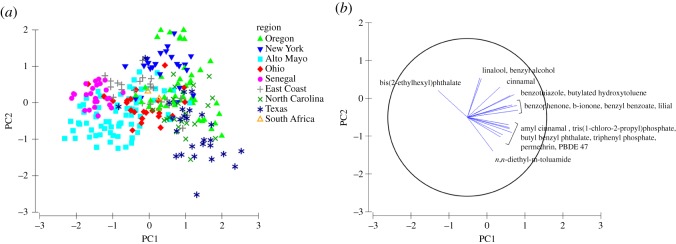
Figure 5.
(a) Principal components analysis of PC1 and PC2 for the presence-absence chemical data from all wristbands, explaining 17% of the total variation, and (b) PC1 and PC2 explain at least 50% of the variation of each chemical vector displayed. Chemical vectors point in the direction of the increasing the density of chemical presence. Symbol shape and colour represents the region where wristbands were worn.

