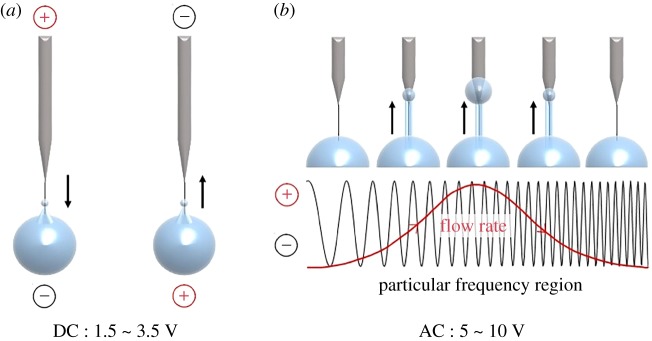
Figure 2.
Schematic diagram of controlling liquid flow using direct current (DC) and alternating current (AC) electric fields. (a) DC conditions: liquid flowed to the electrode having a negative bias. (b) AC conditions: one-directional flow was generated above 5 V and in the MHz frequency range. The flow rate of the transported liquid was maximized at a particular frequency.

