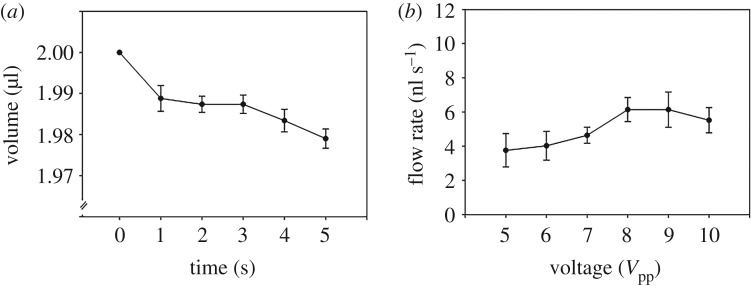
Figure 3.
Flow rates with changing applied voltage. (a) Change in mother droplet volume over a 5 s time period (frequency: 60 MHz; ion concentration: 50 mM; and offset voltage: 0 V). (b) Flow rates as the applied voltage varied from 5 to 10 Vpp. The flow rates increased with the applied voltage from 5 to 8 Vpp and were proportional to the power (R2 = 0.99). Values were analysed by paired t-test, mean ± standard error, n = 7, *p < 0.05.

