Fig. 5.
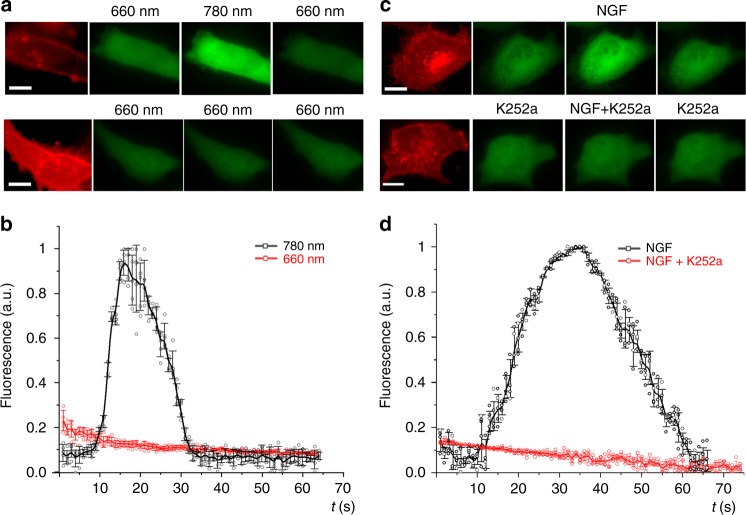
Activation of calcium signaling by Dr-TrkA. a Images of HeLa cells co-expressing mCherry-Dr-TrkA and GCaMP6m. Upper row: cells under constant 660 nm light (0.5 mW cm−2) were stimulated with 20 s pulse of 780 nm light (0.5 mW cm−2). Bottom row: the same cells under constant 660 nm light (0.5 mW cm−2). Note the decrease of cellular calcium in the last images. Scale bar, 10 μm. b Changes of GCaMP6m fluorescence for Dr-TrkA-expressing cells either stimulated by 780 nm light for 20 s (black line) or kept under 660 nm light (red line). c Images of HeLa cells co-expressing TrkA-DsRed2 and GCaMP6m. Upper row: cells before and after addition of 50 ng ml−1 nerve growth factor (NGF). Bottom row: cells stimulated with NGF in the presence of 100 nM of K252a. Note the decrease of cellular calcium in the last images. Scale bar, 10 μm. d Changes of GCaMP6m fluorescence upon stimulation of the cells with NGF in the absence (black line) or presence of K252a (red line). Error bars represent s.d., n = 3 experiments

