Fig. 7.
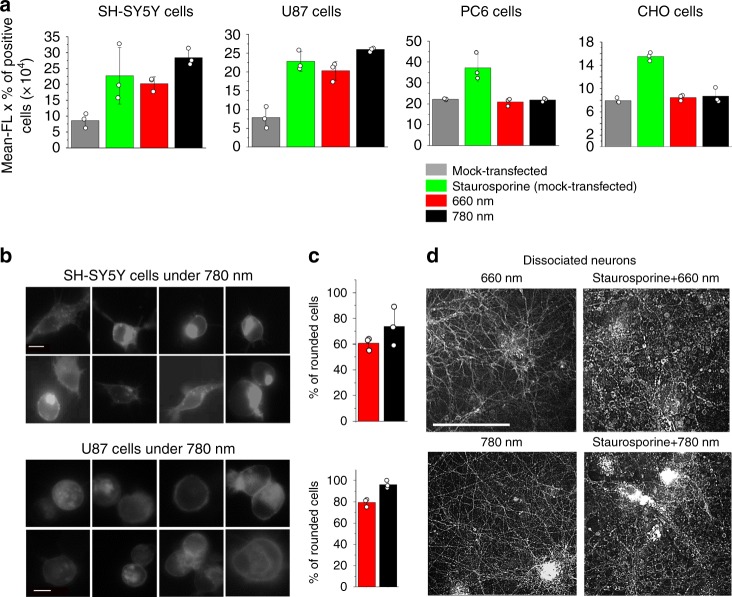
Regulation of apoptosis in neuroblastoma and glioblastoma by Dr-TrkA. a SH-S5Y5, U87, PC6-3, and CHO cells were co-transfected in 48-well plate with 250 ng mixture of the pCMVd2-mCherry-Dr-TrkA and pcDNA3.1 plasmids in the 1:1 mass ratio. The transfected cells were illuminated with either 660 nm or 780 nm light for 6 h, stained with annexin V, and analyzed using flow cytometry. As a positive control, cells transfected with pcDNA3.1 only (mock-transfected cells) were treated with 100 nM staurosporine. b Epifluorescence images of SH-SY5Y and U87 cells transfected with mCherry-Dr-TrkA illuminated with near-infrared (NIR) light, Scale bar, 10 μm. c Quantification of the rounded cells under either 660 nm or 780 nm light. Error bars represent s.d., n = 3 experiments. d Epifluorescence images of cultured rat cortical neurons transduced with adeno-associated virus serotype 9 (AAV9) encoding mCherry-Dr-TrkA. At 24 h after the transduction, neurons were illuminated for 6 h with either 660 nm or 780 nm light. As a positive control, the transduced neurons were treated with 100 nM staurosporine for 6 h. Scale bar, 100 μm. Error bars represent s.d., n = 3 experiments

