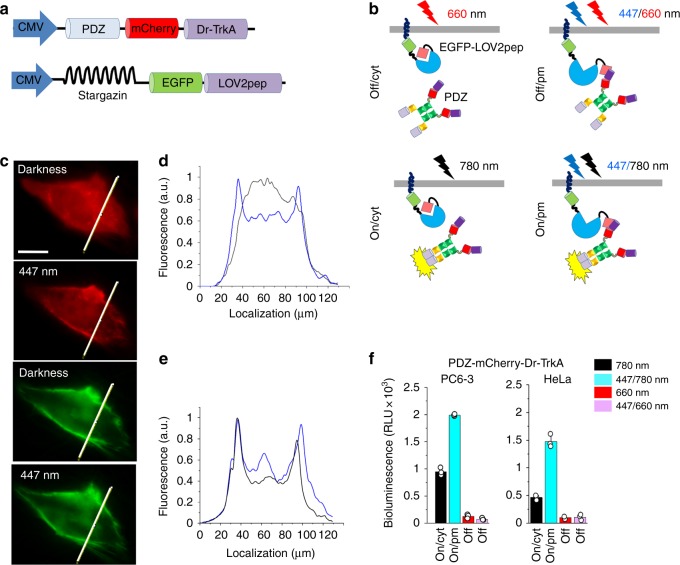
Fig. 8.
Regulation of Dr-TrkA activity with FR–NIR and localization with blue light. a Scheme of cytoplasmic PDZ-Cherry-TrkA and membrane-anchored stargazin-EGFP-LOV2pep constructs used for targeting of Dr-TrkA to the plasma membrane with blue light. b Translocation of the PDZ-mCherry-Dr-TrkA from the cytoplasm to the plasma membrane upon illumination with blue light and activation of the kinase with 780 nm light. c Top: Representative epifluorescence images of the HeLa cell in mCherry channel co-expressing PDZ-mCherry-TrkA and stargazin-EGFP-LOV2pep before and after 30 s of 447 nm illumination (0.3 mW cm−2). Bottom: Representative epifluorescence images of the same HeLa cell in EGFP channel. Scale bar, 10 μm. d, e The intensity profiles of the HeLa cells co-expressing PDZ-Cherry-TrkA and stargazin-EGFP-LOV2pep constructs kept in darkness (black line) or after 30 s of 447 nm light (0.3 mW cm−2) (blue line) imaged in mCherry channel (d) and EGFP channel (e). f Luciferase assay for Elk-1-dependent transcription in PC6-3 cells co-transfected with pPDZ-Cherry-Dr-TrkA, pStargazin-EGFP-LOV2pep, pFr-Luc, and pFA-Elk-1 plasmids. Cells were kept for 30 h under 780 nm light (0.3 mW cm−2), alternating 30 s pulses of 780 nm light (0.3 mW cm−2) and 447 nm light (0.3 mW cm−2), 660 nm light (0.3 mW cm−2) or alternating 30 s pulses of 660 nm light (0.3 mW cm−2) and 447 nm light (0.3 mW cm−2). After illumination cells were lysed and analyzed for luciferase activity. Error bars represent s.d., n = 3 experiments

