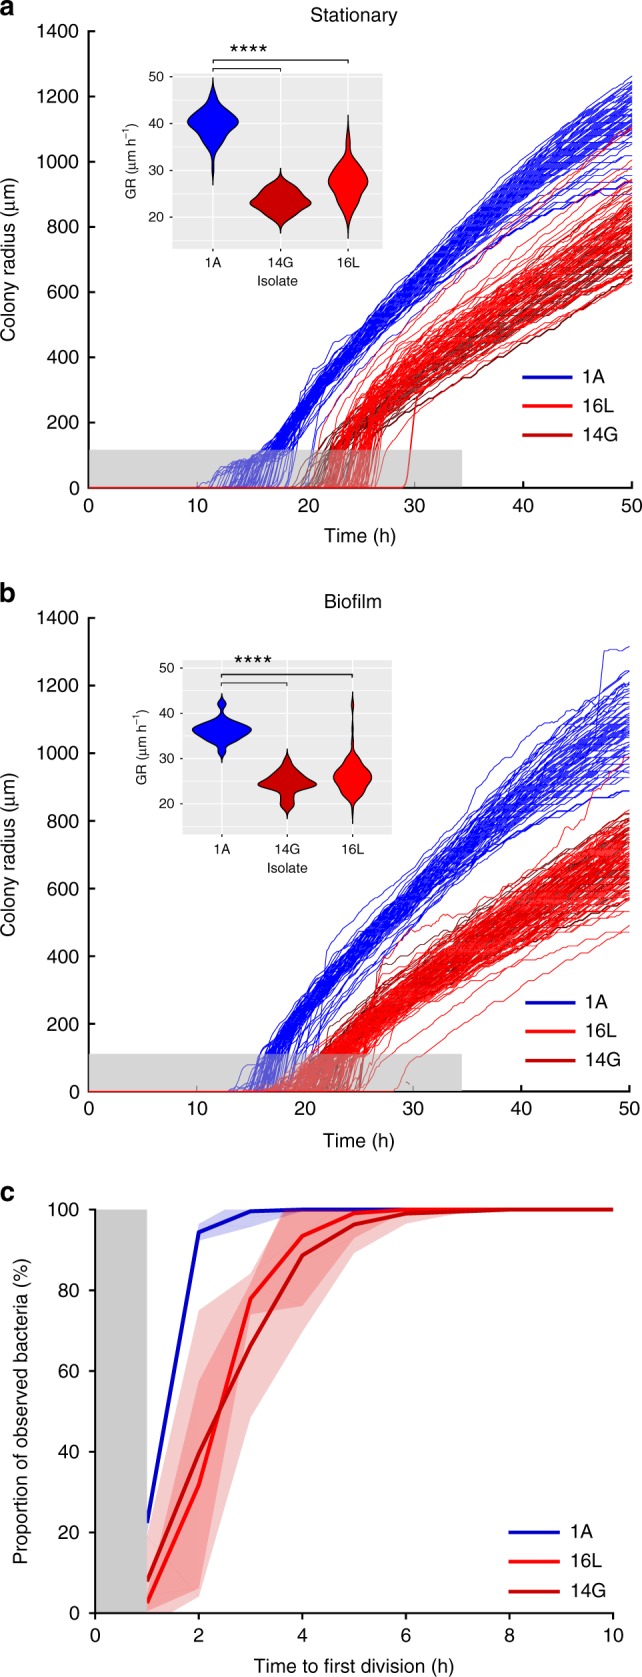
Fig. 5.

Macroscopic and microscopic analysis of the bacterial population’s growth kinetics. a Colony growth curves of bacteria obtained from stationary phase cultures and b biofilms. The gray zone corresponds to a colony radius < 100 µm, which is under the detection limit of the macroscopic time-lapse setup. Small insert graphs show the distribution of the radial colony growth rate (GR) in µm h−1 for the three isolates. Statistical significance between the three samples was determined by one way ANOVA (For the stationary: N = 182, F(2,179) = 488.7, P < 2 × 10⁻¹⁶, and Tukey’s post hoc test t14G-1A = −16.45, p14G-1A = 0, t16L-1A −12.47, p16L-1A = 0/biofilm: N = 237, F(2,234) = 311.8, P < 2 × 10-16 and Tukey’s post hoc test t14G-1A = −11.69, p14G-1A = 0, t16L-1A = −10.05, p16L-1A = 0). c Time to single cells’ first division. Curves show averages of three replicates and shaded areas depict standard deviation. The gray zone marks the period at the beginning of the experiment where cell divisions could occur, but not be observed. Group I and group II isolates are indicated in blue and red, respectively. Dark red indicates the clinical isolate retrieved from the blood culture. ****P < 0.0001
