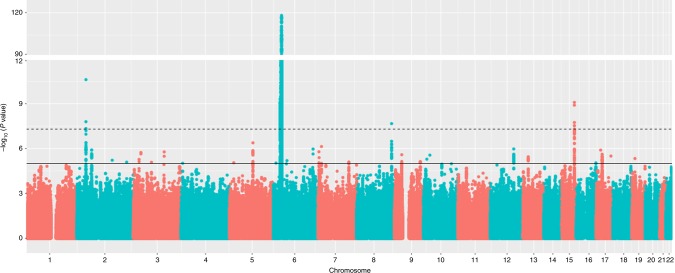
Fig. 2.
Manhattan plot showing the P values for the meta-analysis genome-wide association study. Each SNP was tested for association by logistic regression using an additive regression model; the interrupted line indicates the threshold for genome-wide significance (P = 5 × 10⁻⁸); the y axis has been collapsed for better illustration of all genomic signals; the continuous line represents the threshold for suggestive significance (P = 1 × 10⁻⁵); N = 5161 biologically independent subjects (Ncases = 1044 and Ncontrols = 4145)

