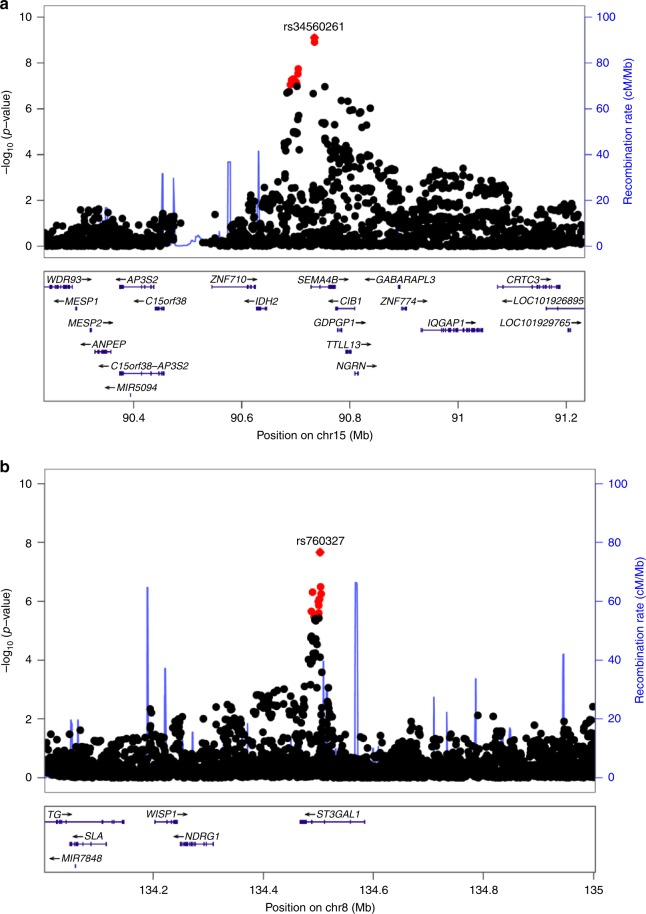
Fig. 3.
Regional plots of lead signals at loci 15q26.1 and 8q24.22. a Regional plot at locus 15q26.1 (rs34560261); and b Regional plot at locus 8q24.22 (rs760327). The blue lines shows the fine-scale recombination rates (right y axis) estimated from individuals in the 1000 Genomes population; genes are highlighted with horizontal lines; the x axis shows the chromosomal position in Mb; variants within the 95% credible set are highlighted in red

