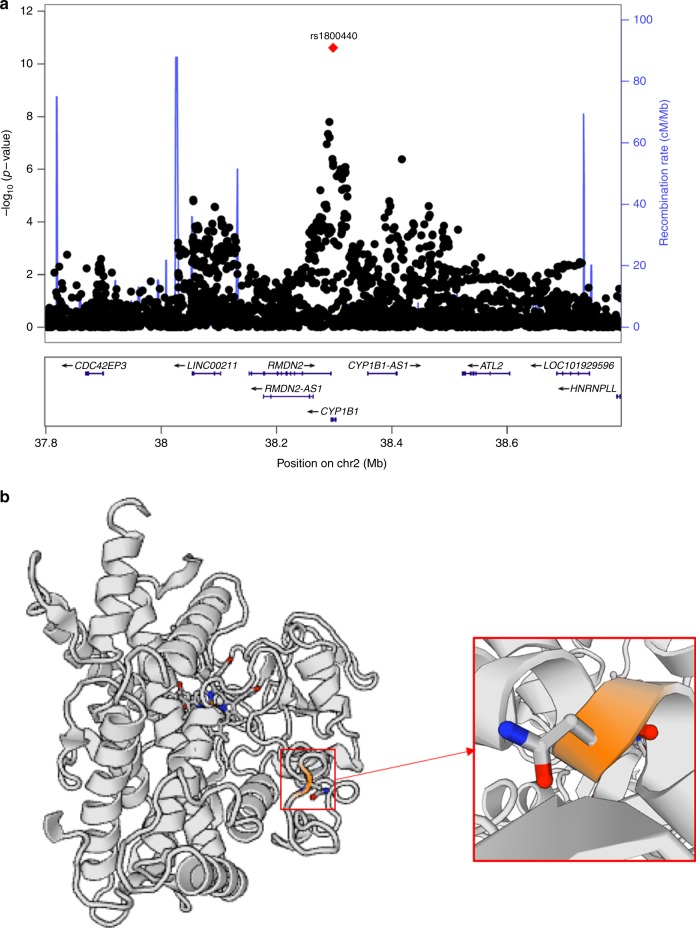
Fig. 4.
Regional plot at locus 2p22.2 and CYP1B1 enzyme structure. a Regional plot of lead signal at locus 2p22.2 demonstrating the lead causal variant (rs1800440); the blue lines shows the fine-scale recombination rates (right y axis) estimated from individuals in the 1000 Genomes population; genes are highlighted with horizontal lines; the x axis shows the chromosomal position in Mb; variants within the 95% credible set are highlighted in red (N = 1, posterior probability = 0.98); b CYP1B1 enzyme structure drawn via the SWISS-MODEL repository with the site affected by the residue change from Asparagine (N) to Serine (S) at position 453 magnified (https://swissmodel.expasy.org/repository)

