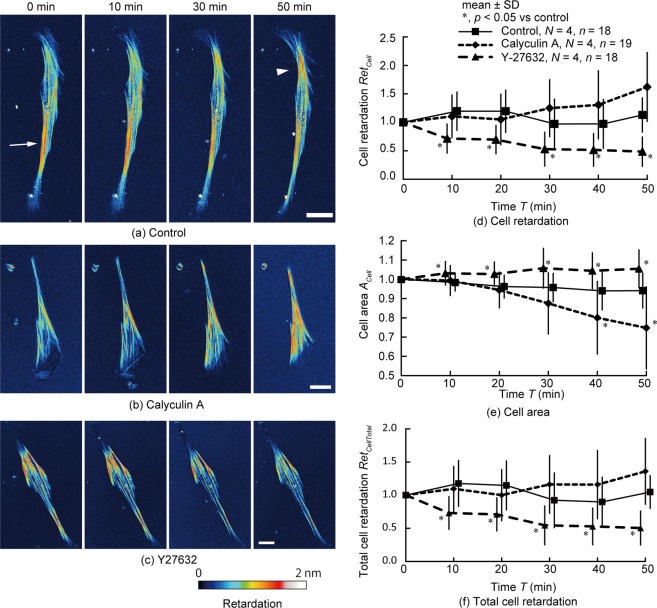
Figure 2.
Changes in retardation with time when the chemical reagent was applied to the cell to alter the cellular contraction state. (a–c) Typical time-lapse images of retardation of single cells after application of (a) DMEM (control), (b) calyculin A, and (c) Y-27632 solution. Bars = 30 µm. The arrow and the arrow head in (a) show the high retardation area. (d–f) Changes in (d) cell retardation, RetCell; (e) cell area, ACell; and (f) total cell retardation, RetCellTotal, with time. Data in (d–f) were normalized by the data at 0 min. *p < 0.05 vs control; N, Number of dishes; n, Number of cells. The colour bar of retardation is applied to all images.

