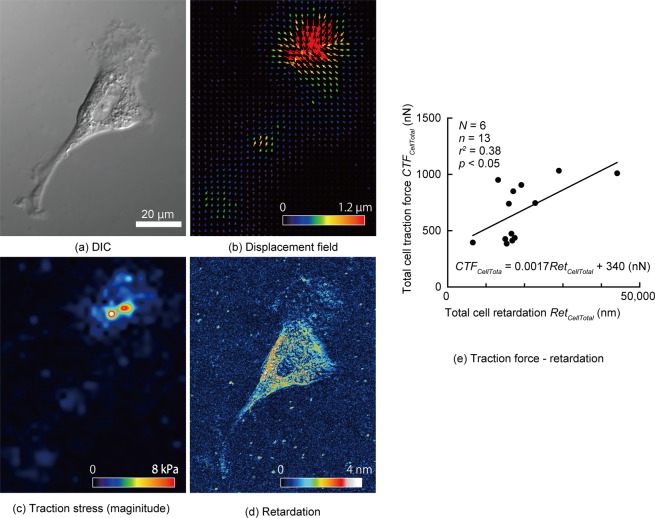
Figure 3.
Relationship between cell traction force (CTF) and retardation. (a–f) Typical images of (a) differential interference contrast imaging, (b) displacement field of beads embedded in the polyacrylamide gel, (c) magnitude of traction stress, and (d) retardation of a VSMC. (e) Relationship between the total cell traction force, CTFCellTotal, and the total cell retardation RetCellTotal, of VSMCs; N, Number of dishes; n, Number of cells.

