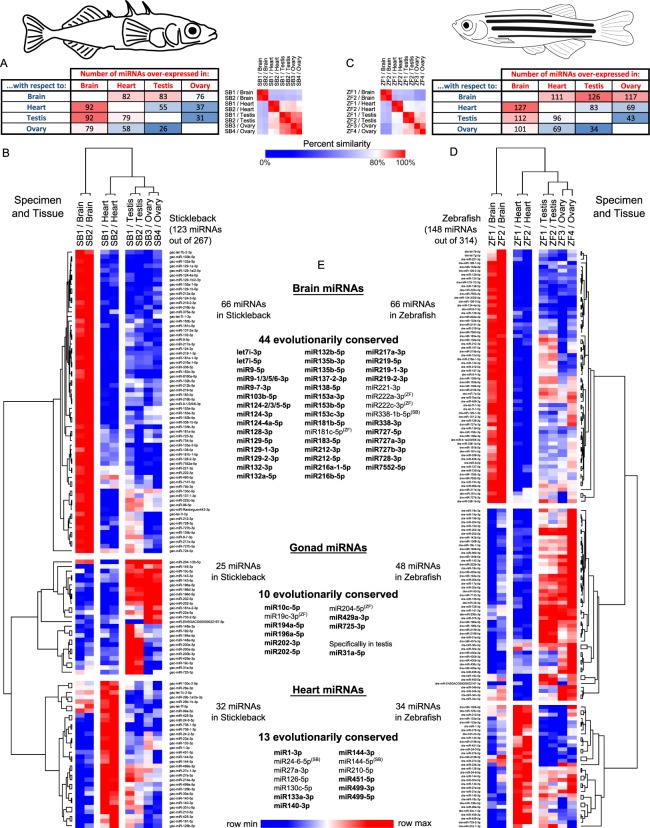
Figure 3.
Differential expression and conservation of miRNAs in stickleback and zebrafish brain, heart, testis, and ovary. (A) Heat map showing the number of stickleback mature miRNAs over-expressed in each organ compared to each other organ along with a sample identity plot that compares the similarities for each of two samples of each organ to the other seven samples tested. (B) Heat map of the 123 stickleback mature miRNAs (in rows) that were consistently enriched in one organ (in columns) compared to the three other organs, or in gonads compared to brain and heart. (C) Heat map of the number of zebrafish mature miRNAs over-expressed in each organ compared to each other organ along with a sample identity plot. (D) Heat map of the 148 zebrafish mature miRNAs consistently enriched in one organ compared to the three other organs, or in gonads compared to brain and heart. For all heat maps, the deepest blue indicates the lowest level of expression in the row and the most intense red indicates the highest level of expression in the row. (E) Lists of organ-enriched miRNAs that are evolutionarily-conserved between stickleback and zebrafish. Bold lettering denotes that the miRNA has an OEI > 0.85 in both species. Superscripted SB (Stickleback) or ZF (Zebrafish) denotes that this specific miRNA has an OEI > 0.85 in the corresponding species but not in the other.

