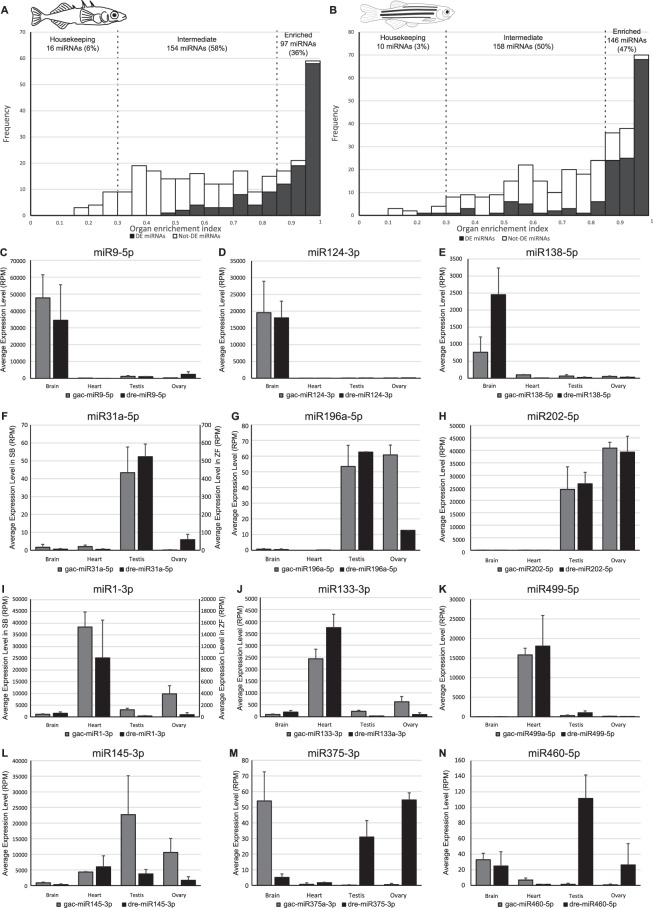
Figure 4.
miRNA organ-enriched expression. (A,B) Frequency plot of OEI (organ enrichment index) values for all stickleback and zebrafish miRNAs expressed at more than 5 RPM across the entire dataset. Grey bars represent miRNAs that were also enriched in brain, heart, testis, ovary, or in both gonads, and white bars represent miRNAs that were not found to be enriched in a specific organ. (C–N) Average organ expression of evolutionarily-conserved, organ-enriched miRNAs that have an OEI > 0.85. Expression levels are given in RPM (Reads per Million) with associated standard deviations for the four organs studied in both stickleback (grey bars) and zebrafish (black bars).

