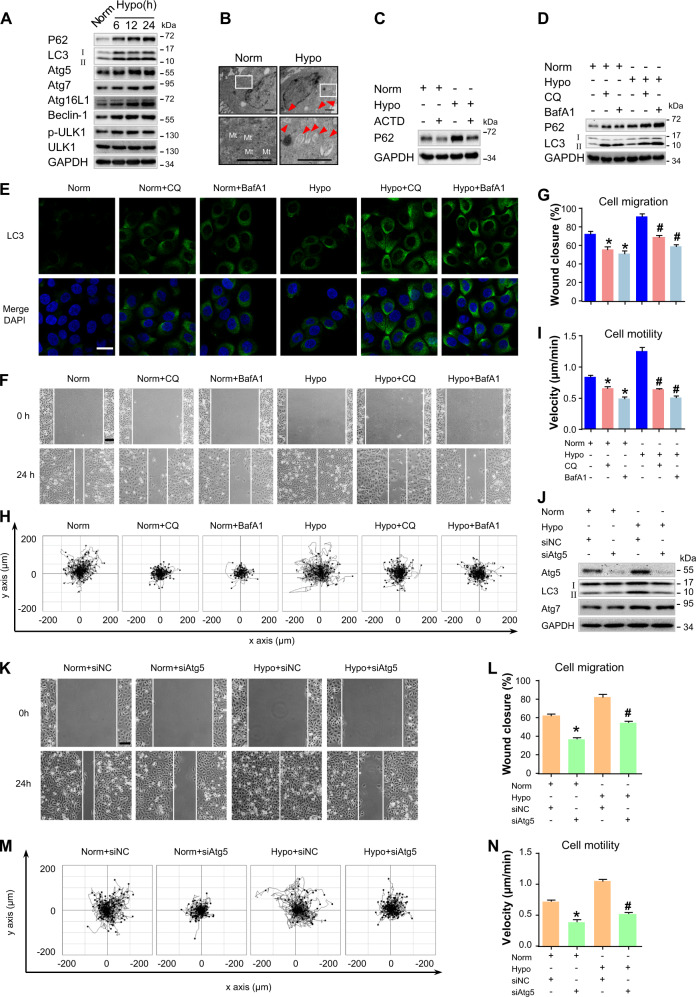
Fig. 2. Autophagy is activated in hypoxic keratinocytes and is required for cell migration.
a HaCaT cells were exposed to hypoxia (2%) and incubated for the indicated times, and total proteins were harvested for detection of autophagy markers (LC3, P62, Atg5, Atg7, Atg16L1, Beclin-1, and p-ULK1) via Western blotting. GAPDH was used as the loading control. b HaCaT cells were exposed to hypoxia (2%) for 6 h and were observed for autophagosomes using transmission electron microscopy. Representative micrographs are shown. The boxed areas represent higher magnification to illustrate details. Red arrows indicate autophagy vacuoles. Scale bar = 1 μm. Mt mitochondria. c HaCaT cells were treated with actinomycin D (ACTD, 5 nM) for 1 h to inhibit transcription and then incubated for 6 h under normoxic or hypoxic conditions. GAPDH was used as the loading control. d–i HaCaT cells were exposed to hypoxia (2%) and incubated for 6 h. Autophagy inhibitors, namely, chloroquine (CQ, 10 μM) and Bafilomycin A1 (BafA1, 10 nM), were added 1 h prior to hypoxia exposure. The extracted proteins were immunoblotted with the indicated antibodies (d). e Fluorescence staining of LC3 expression (green) in the indicated HaCaT cells. Nuclei were stained with DAPI (blue). Wound-healing assays (f, g) and single-cell motility assays (h, i) were performed to test the effects of autophagy inhibitors on keratinocyte migration. Representative images of wound healing, including keratinocyte trajectories. Scale bar = 100 μm. Quantitative results are represented by the mean ± SEM (n = 3). *P < 0.05 vs. the Norm group, and #P < 0.05 vs. the Hypo group. j Western blotting was used to analyze Atg5, Atg7, and LC3 expression in HaCaT cells treated with 100 nM Atg5 siRNA (siAtg5) or siRNA-negative control (siNC) under indicated conditions. GAPDH was used as the loading control. The effects of Atg5 siRNA on keratinocyte migration were also determined by wound-healing assays (k, l) and single-cell motility (m, n) assays. Representative images of wound healing, including keratinocyte trajectories. Scale bar = 100 μm. Quantitative results are represented by the mean ± SEM (n = 3). *P < 0.05 vs. the Norm group, and #P < 0.05 vs. the Hypo group. Norm normoxia, Hypo hypoxia

