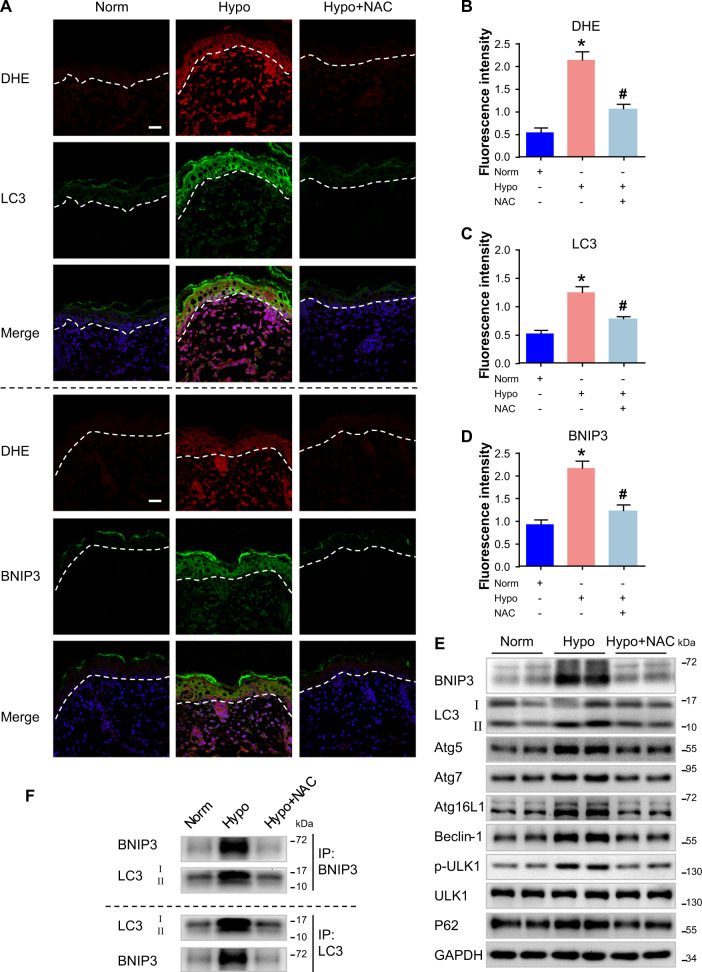
Fig. 4. Increased ROS production induced by hypoxia drives epidermal BNIP3 expression in vivo.
Skin specimens from the dorsal coat of newborn mice were cultured in 6-well plates and exposed to hypoxia (2% O2) for 6 h. The N-acetylcysteine (NAC) antioxidant was added 1 h before hypoxia exposure. a After organ culture, skin sections were processed for costaining of dihydroethidine (DHE) and LC3 or BNIP3. Blue signals (DAPI) indicate nuclear staining. Dotted line indicates the boundary between the epidermis and dermis. Scale bars = 25 μm. b–d Graphs indicate the relative fluorescence intensities as determined by ImageJ software. The results are represented by the mean ± SEM (n = 3). *P < 0.05 vs. Norm group, and #P < 0.05 vs. Hypo group. e Western blots were performed to analyze the expression of BNIP3, LC3, P62, Atg5, Atg7, Atg16L1, Beclin-1, and p-ULK1 in cultured skin when subjected to NAC under hypoxia. Representative bands of two samples in each group are shown. GAPDH was used as the loading control. f The indicated cultured skins were lysed in lysis buffer and then immunoprecipitated with anti-BNIP3 or anti-LC3 antibodies followed by immunoblotting with anti-LC3 or anti-BNIP3 antibody

