Fig. 2.
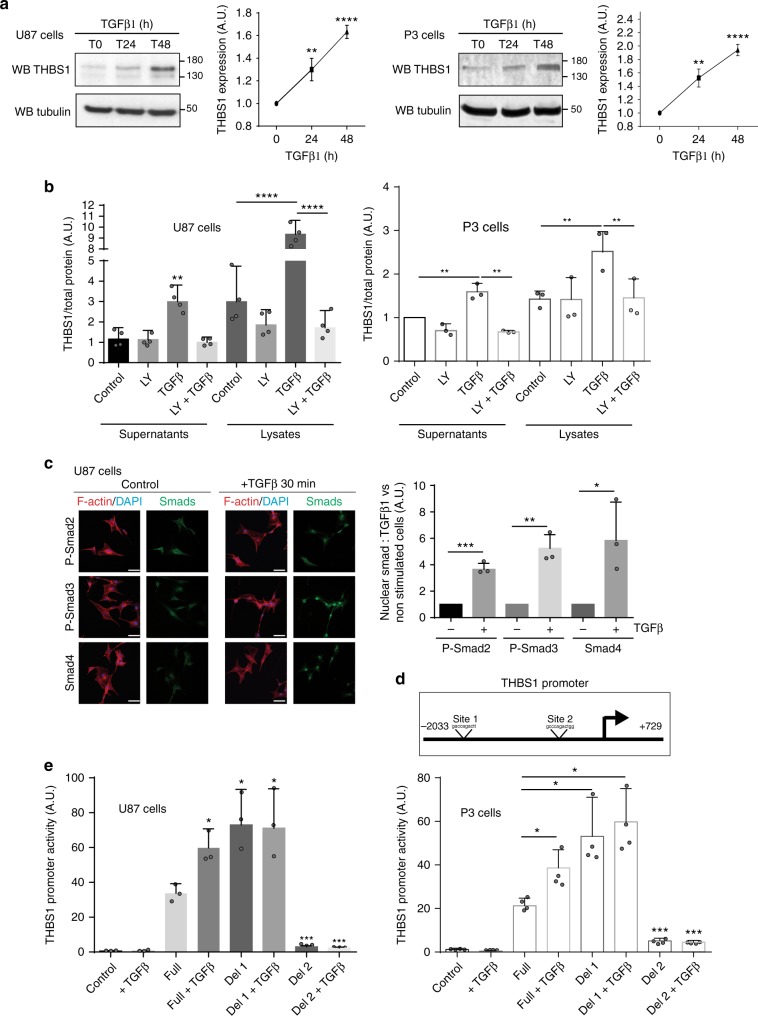
THBS1 expression is regulated by TGFβ1 via SMAD3 promoter binding. a Analysis of THBS1 expression in protein extracts from non-treated or TGFβ1-treated U87 (left) and P3 (right) cells (24 or 48 h treatment). TGFβ1 was used at a concentration of 5 ng/ml. The graphs represent quantifications of THBS1 signal normalised to Tubulin (n = 3). Densitometry analysis (right panels) is represented as fold induction compared to control. Student’s t-test P- value: **P < 0.01; ****P < 0.0001. b ELISA experiment performed on U87 (left) and P3 (right) cell supernatants or lysates, treated with 5 ng/ml of TGFβ1, 10 µM of TGFβR inhibitor LY2157299 or combination treatment for 48 h. The graph represents a mean of four (U87) or three (P3) independent experiments as fold induction to non-treated cells. c Representative immunofluorescence images of starved U87 control or TGFβ1-treated cells (30 min TGFβ1 treatment with a concentration of 5 ng/ml) showing nuclear translocation of P-SMAD2, P-SMAD3 or SMAD4. Staining: Smads (green), Phalloidin for F-Actin (red) and DAPI for nuclei (blue). Scale bars: 10 µm. The graph on the right represents a mean of three independent experiments (100 cells analysed in each), as fold induction vs non-treated cells. d Schematic representation of SMAD3-binding sites on THBS1 promoter. Binding site 1 is located at −1125/−1115 and binding site 2 at −110/−100 on the THBS1 promoter. e Luciferase promoter activity was measured by transfecting a PGL3 vector containing the full-length THBS1 promoter (Full) or inserts deleted either in binding site 1 (Del1) or binding site 2 (Del2). A GFP plasmid was used as a control. U87 (left) and P3 (right) cells were starved for 24 h and treated with 5 ng/ml of recombinant TGFβ1. The results are represented of three (U87) or four (P3) independent experiments. All graphs are represented as means ± s.d. *P < 0.05; **P < 0.01; ***P < 0.001; ns, not significant (ANOVA)

