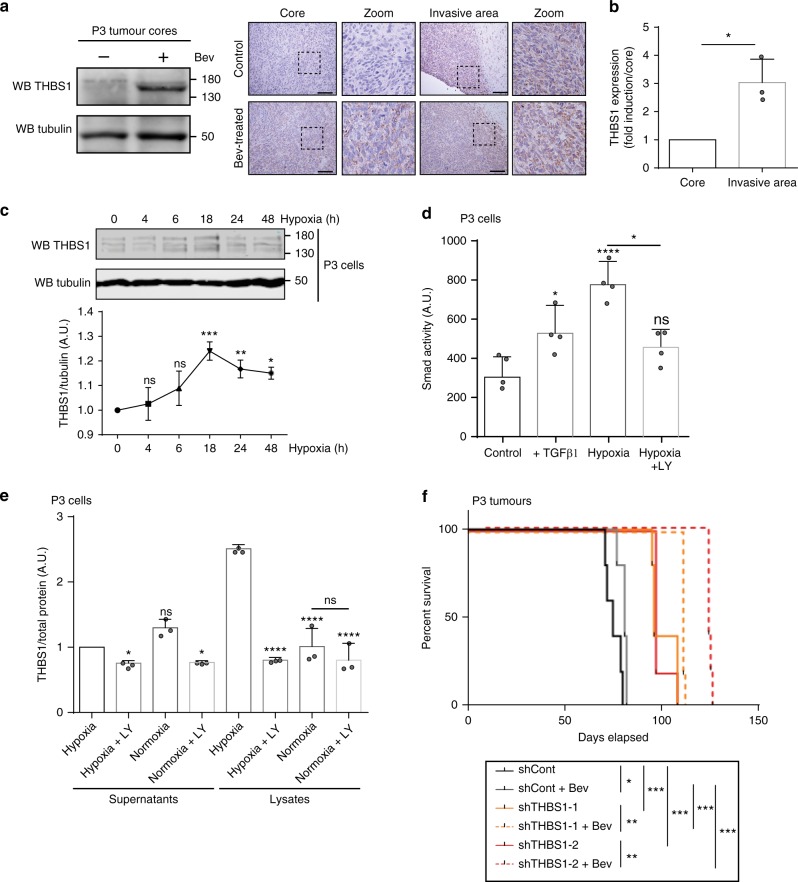
Fig. 4.
THBS1 is induced by hypoxia through TGFβ1 activation. a Protein extracts from P3 tumour cores were analysed by western blot probed with anti-THBS1 and anti-Tubulin antibodies (left panel). Representative images of P3 control or bevacizumab-treated tumours stained for THBS1 (brown) and counterstained with haematoxylin (blue) are shown (right panels). Images represent the core and the invasive areas of both tumours. Scale bars: 100 µm. b qPCR of THBS1 transcript from the core or the invasive area of P3 tumours, after laser microdissection. Three independent tumours were analysed, results are represented as means ± s.d and compared to the tumour core. *P < 0.05 (Student t-test). c Immunoblots of protein extracts from P3 cells exposed to hypoxia (1% O2) for 4, 6, 18, 24 or 48 h, and probed with anti-THBS1 or anti-Tubulin antibodies. The graph below represents ratios of THBS1 and Tubulin signal intensities. Results are represented as means ± s.d. of three independent experiments. *P < 0.05; **P < 0.01; ***P < 0.001; ns, non-significant (Student t-test, comparison to time 0). d P3 cells were incubated under normoxia (21% O2) or hypoxia (1% O2) for 48 h and stimulated or not with 5 ng/ml of recombinant TGFβ1 or 10 µM of LY2157299. Cells were transfected with SRE construct and luciferase activity was assessed. Results are represented as means ± s.d. of four independent experiments. e ELISA experiments performed on P3 cell lysates and supernatants. Cells were treated or not with 10 µM of TGFβR inhibitor LY2157299, in normoxic or hypoxic conditions for 48 h. The graph represents three independent experiments as fold induction in comparison to non-treated cells (mean ± s.d.). *P < 0.05; **P < 0.01; ***P < 0.001; ****P < 0.0001; ns, non-significant (ANOVA). f Kaplan–Meier survival curves of mice with intracranially implanted control (grey lines), THBS1-1 (orange lines) or THBS1-2 (red lines) shRNA-transduced P3 cells. Animals were treated or not with Bevacizumab (Bev) (n = 7 mice per group); P-values were calculated with log-rank test; *P-value < 0.05; **P-value < 0.01; ***P-value < 0.001

