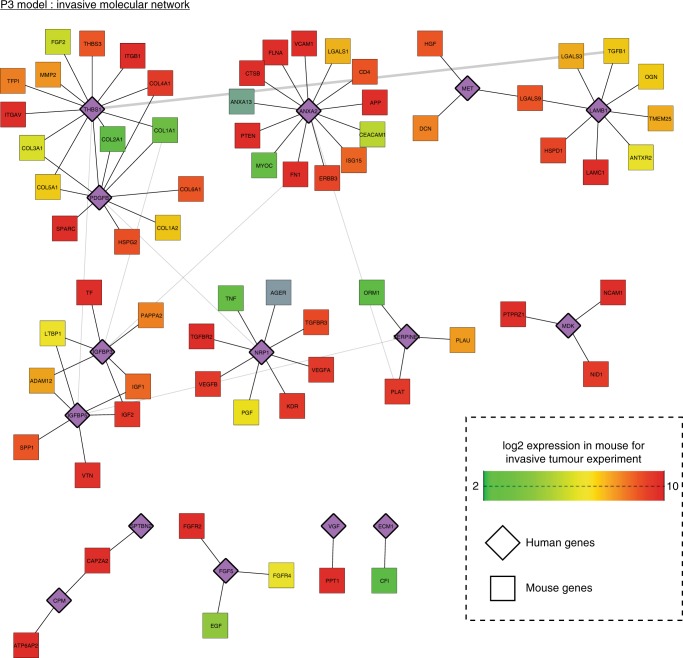
Fig. 7.
Transcriptional analysis highlights THBS1 as central regulator of GBM invasion. A network of proteins encoded by genes that are overexpressed in the invasive area of P3 tumours when compared to the core area, or are expressed by the host. Relationships in the network represent known protein–protein interactions. Human genes are represented in purple and mouse genes are colour coded according to their expression (green (2) – red (10); normalised counts in log2 scale)

