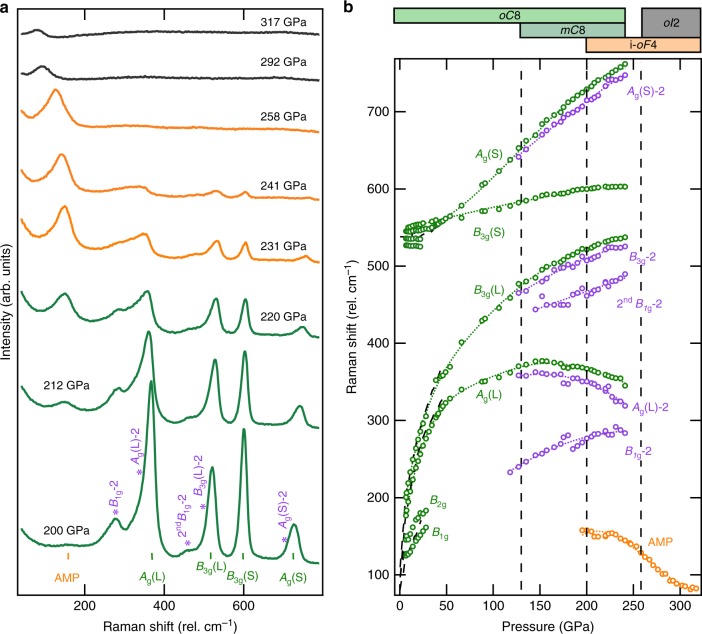
Fig. 2.
Raman measurements above 200 GPa. a Raman spectra collected of solid chlorine up to 317 GPa. Excitations corresponding to oC8 (green markers: Ag(L), B3g(L), B3g(S), Ag(S)), mC8 (purple markers: B1g(L)-2, Ag(L)-2, B3g(L)-2, Ag(S)-2) and the amplitude mode (orange markers: AMP) of the i-oF4 phase are denoted below the lowest pressure spectra. b Frequencies of excitations present in solid chlorine as a function of pressure, black dashed curves are from ref. 20. The vertical dashed lines denote phase transitions, with the corresponding 1-D phase diagram provided atop of the figure describing the evolution and coexistance found in chlorine’s phase behaviour. The abundance of each phase in coexistance can be qualitatively approximated from the intensities of their excitations, seen here in panel a and quantified in Supplementary Figure 2b

