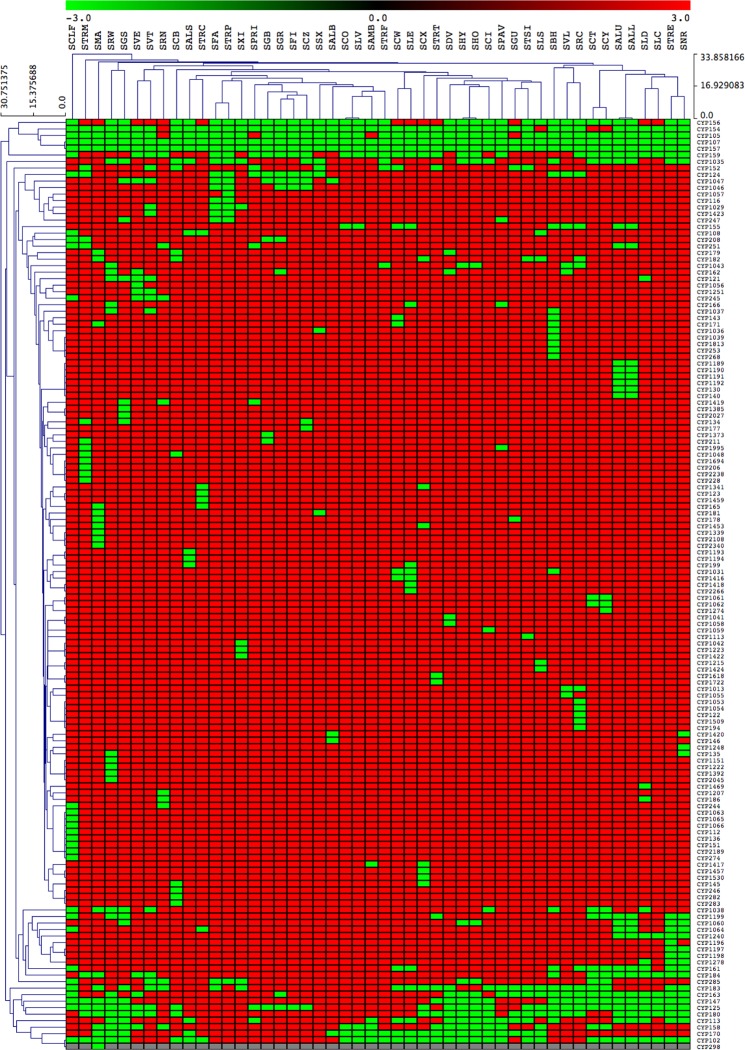
Figure 3.
Heatmap of the presence or absence of P450 families in 48 Streptomyces species. Forty-eight Streptomyces species form the horizontal axis (see Table S2 for species codes) and P450 families (right side) and the phylogenetic relationship among P450 families (left side) form the vertical axis. The data have been represented as −3 for family presence (green) and 3 for family absence (red). The data used in the generation of the figure are presented in Supplementary Dataset-sheet 2.

