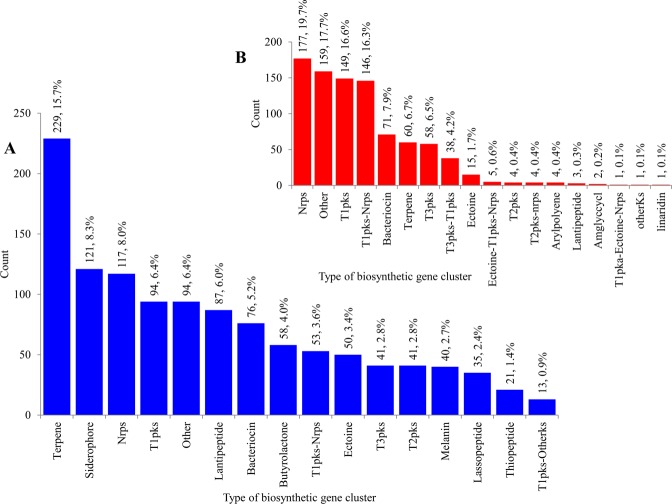
Figure 7.
Comparative analysis of types of BGCs between Streptomyces species (A) and mycobacterial species. (B) The numbers next to bars represent the number of secondary metabolite BGCs and their percentage in the total number of BGCs found in 48 Streptomyces species (A) or 60 mycobacterial species. (B) Comparative analysis of types of secondary metabolite BGCs in Streptomyces species and mycobacterial species were presented in Supplementary Datasets 5 and 6, respectively. Furthermore, comprehensive comparative analysis of different types of secondary metabolite BGCs between Streptomyces and Mycobacterium is presented in Table S7.

