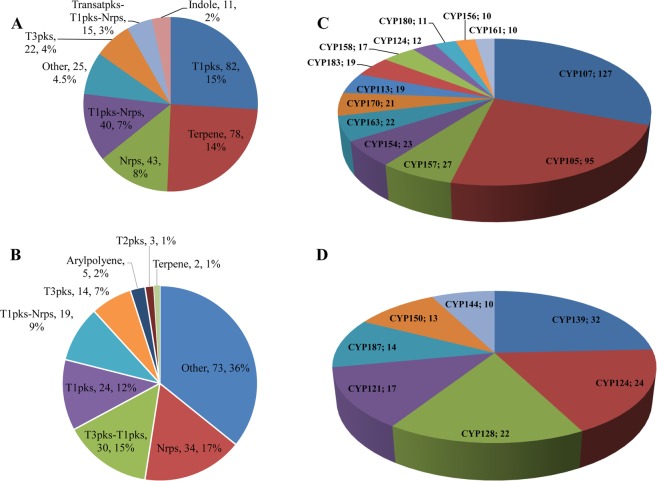
Figure 9.
Comparative analysis of P450s associated with secondary metabolism. Comparative analysis of BGCs containing P450s in 48 Streptomyces species (A) and 60 mycobacterial species. (B) Numbers next to BGCs indicate the number of BGCs and their percentage in the total number of BGCs containing P450s (for details see Tables S8 and S9). Comparative analysis of P450 families that are part of secondary metabolite BGCs in Streptomyces species (C) and mycobacterial species. (D) The P450 families that are dominantly present in different BGCs are presented in the figure. The number after the P450 name indicates the number of member P450s. Detailed information on P450s that are part of BGCs is presented in Table S10.

