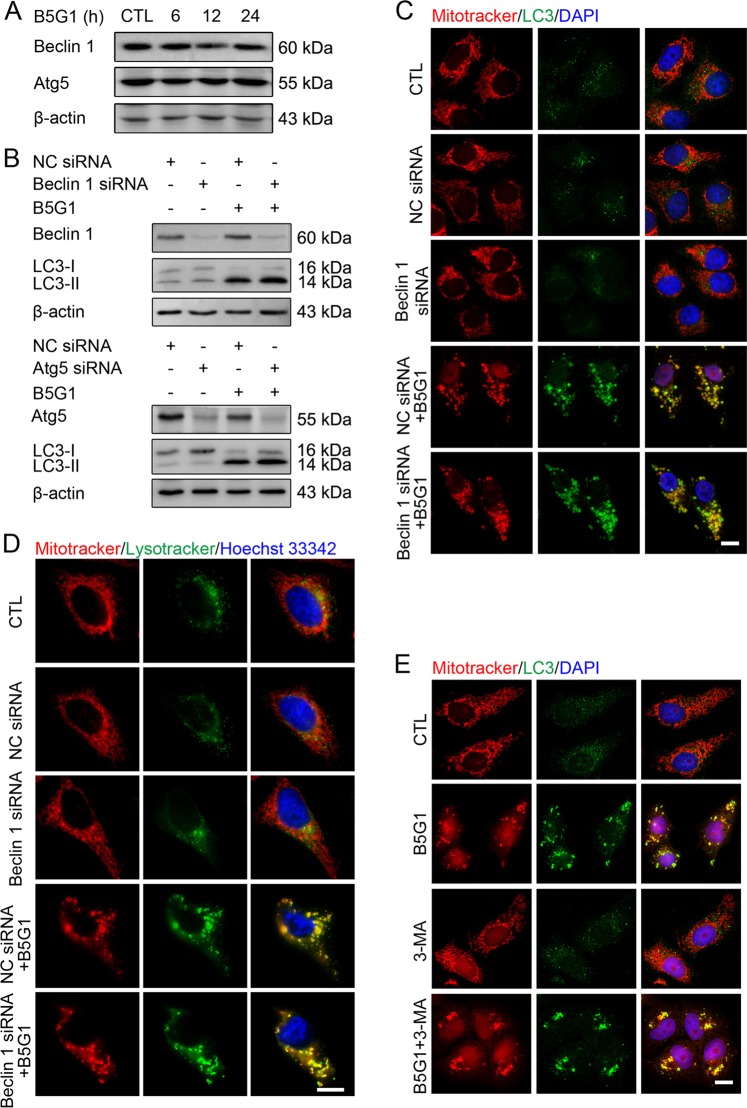
Fig. 3. B5G1 induces mitophagy through a nonclassical autophagy pathway.
a Autophagy-related proteins expression level of HepG2/ADM cells treated with B5G1 (6 µM) for the indicated times was analyzed by Western blotting. β-actin was used as a loading control. b HepG2/ADM cells were pretreated with NC siRNA, Beclin 1, or Atg5 siRNA for 24 h, followed by treatment with B5G1 (6 µM) for 12 h. Beclin 1, Atg5, and LC3 expression levels were determined by western blotting. β-actin was used as a loading control. c HepG2/ADM cells pretreated with NC or Beclin 1 siRNA were exposed to B5G1 (6 µM) for 24 h, the cells were stained with MitoTracker red (200 nM) followed by immunostaining with a LC3 antibody. Mitochondrial colocalization with LC3 was detected by a fluorescence microscope. Magnification: ×630; scale bar: 10 μm. d HepG2/ADM cells pretreated with NC or Beclin 1 siRNA were exposed to B5G1 (6 µM) for 24 h, the cells were then stained with MitoTracker red (200 nM), LysoTracker green (100 nM) and Hoechst 33342 (2 μg/ml), and mitochondrial colocalization with lysosomes was detected by a fluorescence microscope. Magnification: ×630; scale bar: 10 μm. e HepG2/ADM cells pretreated with 3-MA (5 mM) for 1 h were exposed to B5G1 (6 µM) for 24 h, the cells were stained with MitoTracker red (200 nM) followed by immunostaining with a LC3 antibody. Mitochondrial colocalization with LC3 was detected by a fluorescence microscope. Magnification: ×630; scale bar: 10 μm

