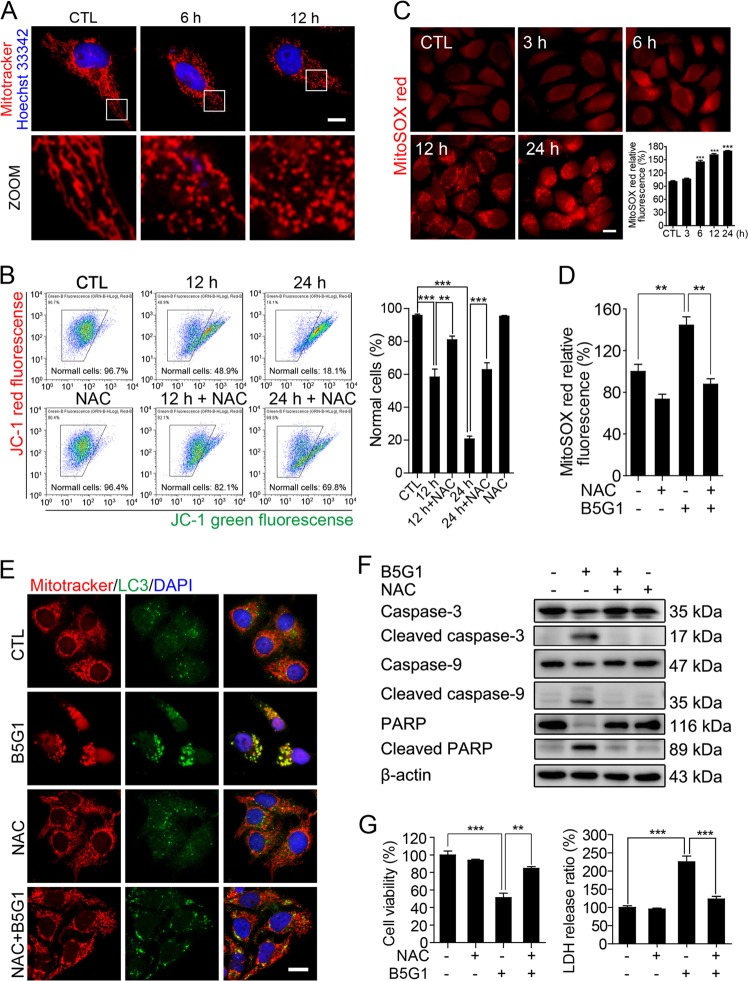
Fig. 7. B5G1 activates mitophagy by inducing mitochondrial ROS overproduction.
a After treatment with B5G1 (6 μM) for the indicated times, HepG2/ADM cells were stained with MitoTracker red (200 nM) and Hoechst 33342 (2 μg/ml), the mitochondrial morphology was observed by a fluorescence microscope. Magnification: ×630; scale bar: 10 μm. b HepG2/ADM cells were treated with B5G1 (6 μM) in the presence or absence of NAC (20 mM) for 12 and 24 h, changes in MMP were determined using JC-1 staining by flow cytometry analysis (n = 3). **P < 0.01, ***P < 0.001. c HepG2/ADM cells were treated with B5G1 (6 μM) for the indicated times, and stained with MitoSOX red (10 μM), the fluorescence was observed by a fluorescence microscope or measured by a microplate reader. Magnification: ×630; scale bar: 10 μm (n = 3), ***P < 0.001 vs CTL. d HepG2/ADM cells were treated with B5G1 (6 μM) in the presence or absence of NAC (20 mM) for 6 h, and stained with MitoSOX red (10 μM), the fluorescence was measured by a microplate reader (n = 3). **P < 0.01. e After treatment with B5G1 (6 μM) in the presence or absence of NAC (20 mM) for 24 h, HepG2/ADM cells were stained with MitoTracker red (200 nM) and immunostained with a LC3 antibody, mitochondrial colocalization with LC3 was observed by a fluorescence microscope. Magnification: ×630; scale bar: 10 μm. f HepG2/ADM cells treated with B5G1 (6 μM) for 48 h in the presence or absence of NAC (20 mM). Apoptosis-related proteins expression level were analyzed by western blotting. β-actin was used as a loading control. g HepG2/ADM cells treated with B5G1 (6 μM) for 48 h in the presence or absence of NAC (20 mM). Cell viability was determined by MTT and LDH assay (n = 3). **P < 0.01, ***P < 0.001

