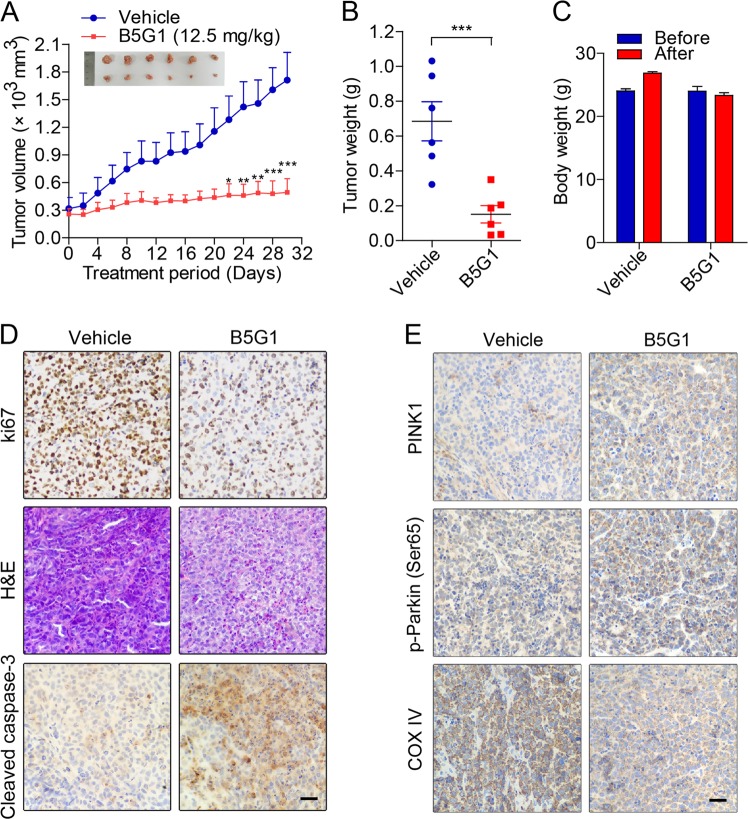
Fig. 8. B5G1 suppresses tumor growth in a HepG2/ADM xenograft model.
a Tumor volumes were measured every other day. At the end of the treatment period, the tumors were taken out and photographed (n = 6). *P < 0.05, **P < 0.01, ***P < 0.001 vs vehicle. b The finall tumors weight were measured. ***P < 0.001. c The mice body weight before and after B5G1 treatment. d The tumor tissues were subjected to H&E staining and immunohistochemistry staining for ki67 and cleaved caspase-3. Scale bar: 50 μm. e The tumor tissues were subjected to immunohistochemistry staining for PINK1, p-Parkin (Ser65), and COX IV. Scale bar: 50 μm.

