Figure 5.
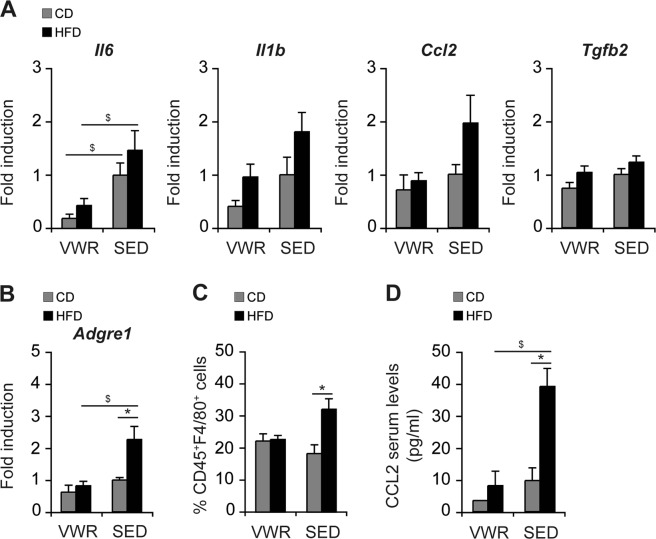
Impact of VWR on HFD-induced hepatic inflammation and macrophage infiltration. (A) Relative mRNA expression levels in whole liver of pro-inflammatory and pro-fibrotic cytokines, and (B) the macrophage-marker F4/80, (C) relative numbers of living, intrahepatic CD45+F4/80+ cells quantified by flow cytometry, and (D) CCL2 serum levels in VWR and SED mice after 12 weeks of exposure to CD or HFD. Data in A and B are means ± SEM of (A,B) n = 7 VWR/CD, n = 8 VWR/HFD, n = 5 SED/CD, n = 5 SED/HFD mice, (C,D) n = 5 VWR/CD, n = 5 VWR/HFD, n = 5 SED/CD and n = 15 SED/HFD mice. *p < 0.05 for CD vs. HFD and $p < 0.05 for SED vs. VWR using Mann-Whitney U test (A,C) or two-tailed Student’s t-test (B,D).

