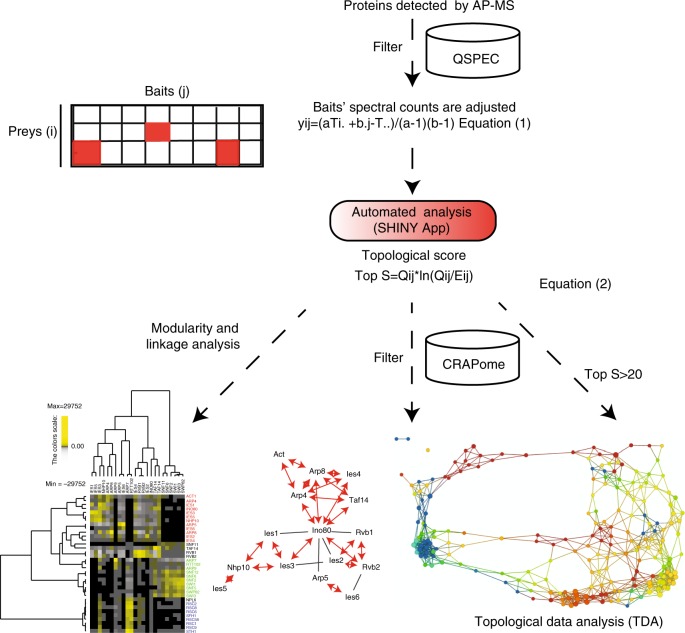
Fig. 1.
Workflow for topological scoring of protein interaction datasets. In the first step, contaminant proteins are filtered using Z scores and FDR generated from QSPEC; however, other approaches could be used. Next, overexpressed bait proteins that have high spectral counts in the data are adjusted using Eq. (1). After prey proteins as baits are adjusted, topological scores (TopS) are then calculated, using an automated SHINY application, as described in Eq. (2), where Qij is the observed count in row i and column j and Eij is the expected count in row i and column j. Direct input of TopS values can be used in many different ways, such as data clustering to investigate the modularity and linkage in a network; additional filtering may be conducted using the CRAPome27, for example; and a topological data analysis network may be generated. FDR false discovery rate

