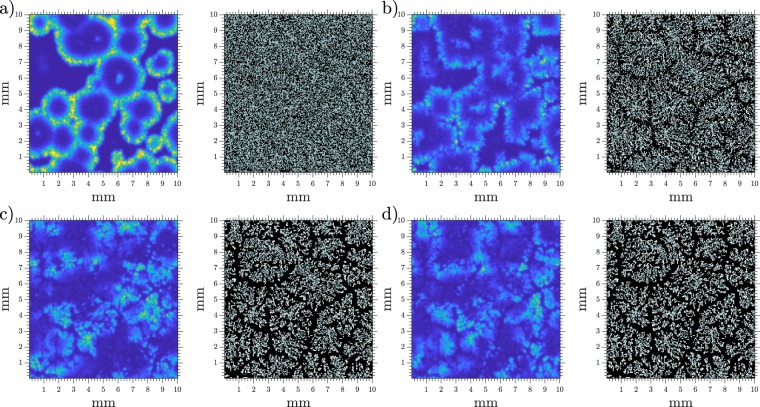
Figure 6.
Snapshots of aggregation at different elapsed times with cell superposition, but only unbounded degradation. cAMP concentration on the left and cell distribution on the right. Same γ scale as in Fig. 3, gray squares show where one cell is present, white squares contain more than one cell, and empty spaces are shown in black. Density = 5 · 105 cells/cm2 (0.5 mono-layer) and ke = 5.7 min−1. (a) t = 39 min, (b) t = 75 min, (c) t = 120 min, and (d) t = 150 min.

