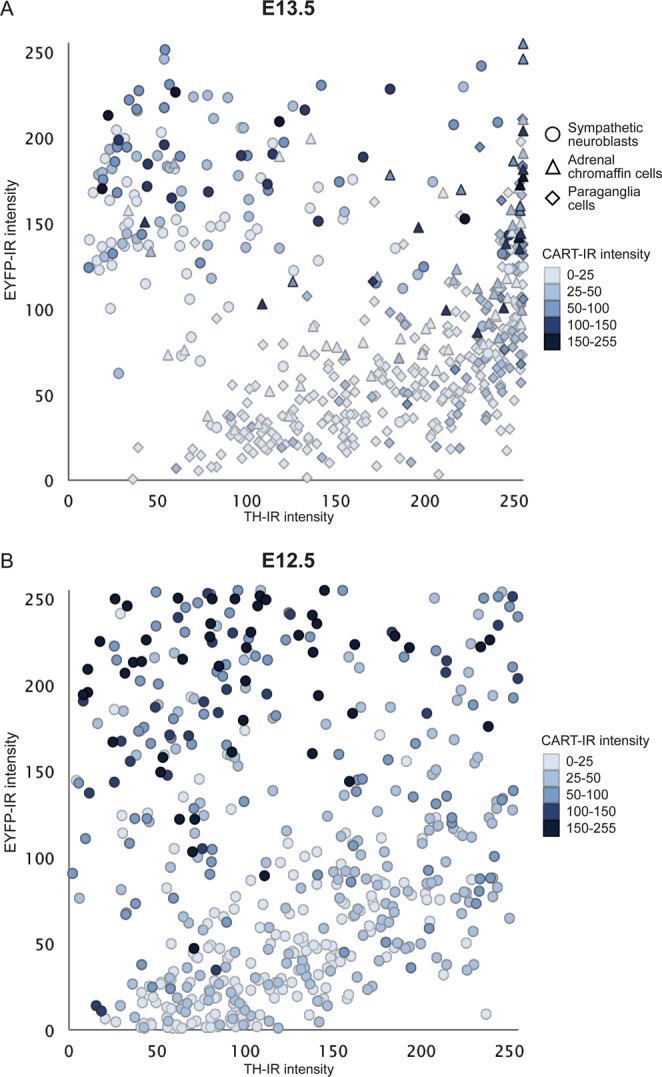
Figure 2.

Scatter plot of the relative fluorescent intensity of TH-IR versus that of EYFP-IR in individual sympathetic neuroblasts and adrenal chromaffin cells in sections through the abdomen of E13.5 (A) and E12.5 (B) TH-Cre::R26R-EYFP mice. CART-IR fluorescence intensity in each cell is shown by the shading of each symbol (darker is more intense CART-IR). Relative fluorescent intensity for TH-IR (X-axis), EYFP-IR (Y-axis) and CART-IR (shading) were measured on a 0–255 scale (0 = no fluorescence, 255 = maximum fluorescence). The upper left quadrant of each plot contained TH-IR Lo/EYFP-IRHi cells while lower right quadrant contained TH-IRHi/EYFP-IRLo cells. For E13.5, cells are identified and categorized into sympathetic neuroblasts (○), paraganglia (△) and adrenal chromaffin cells (◊) based on anatomical segregation into adrenal medulla or sympathetic ganglia. On E12.5, it was not possible to discriminate cell type by anatomical organisation and the cells are unclassified. However, the pattern observed in the plot is identical to that seen at E13.5, leading to the conclusion that cells that are TH-IRLo/EYFP-IRHi and which also express CART-IR are likely to be sympathetic neuroblasts while TH-IRHi/EYFP-IRLo cells lacking CART-IR are likely to be adrenal chromaffin cells. For E13.5, n = 3 embryos, 521 cells and for E12.5, n = 2 embryos, 505 cells.
