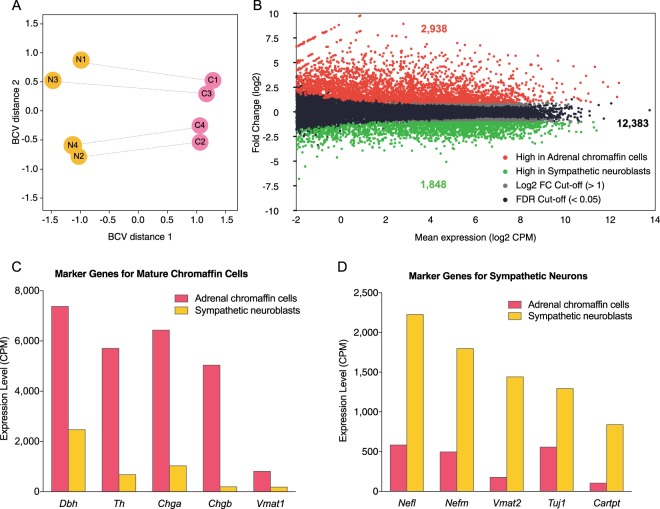
Figure 4.
(A) Principal component analysis plot of biological coefficient of variation (BCV) showing the transcriptome profiles from each of 4 paired (connected by line) E12.5 samples separated clearly by the biological effect of interest i.e. cell types (Dimension 1, X-axis). The effect size of technical batch effect on replicates (Dimension 2, Y-axis) was small, about half of the biological effect. (B) MA-plot of transcriptomic profile in adrenal chromaffin precursor cells versus sympathetic neuroblasts. RNA sequencing analysis of adrenal chromaffin cells and sympathetic neuroblasts revealed 4,786 differential expressed genes with fold change >2 and false discovery rate (FDR) < 0.05 out of 17169 annotated genes, that 2,938 genes expressed higher in adrenal chromaffin cells (red) and 1,848 genes were expressed higher in sympathetic neuroblasts (green). (C,D) The mRNA expression levels of the ten representative cell type-specific marker genes are shown. Markers for chromaffin cells were all expressed at higher level in the adrenal chromaffin cell transcriptomes (C) while markers for neurons were all expressed at higher levels in the sympathetic neuroblast transcriptomes (D).

