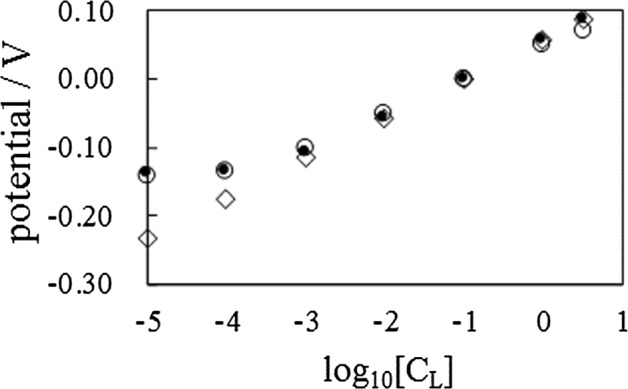
Fig. 5.

Potential vs. log10[CL] ∘: Experimentally measured potential across the Selemion AMV, where the standard deviation increases with the decrease of CL, but it is only ±0.008 V (CL = 10− 5 M) at the largest ◇: Potential computed using the GHK equation when PK = 0 and PCl = 1, ∙: Potential computed using the GHK equation when PK = 0.004 and PCl = 1
