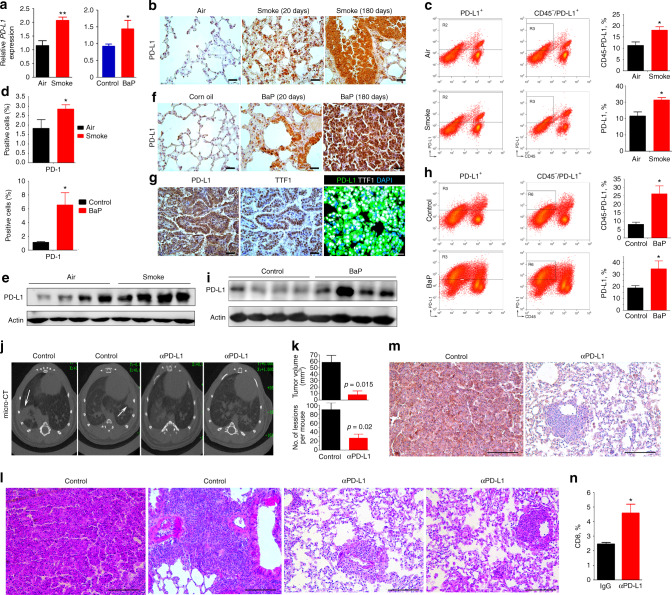
Fig. 2.
Tobacco smoke and BaP induce PD-L1 in mice, whereas inhibition of PD-L1 suppresses BaP-induced lung cancer. a The A/J mice were exposed to tobacco smoke or treated with BaP for 20 days and sacrificed, the expression PD-L1 in lung tissues was detected by real-time PCR. b The lung tissues were isolated and analyzed by immunohistochemistry using an anti-PD-L1 antibody. Scale bar = 2000 μm. c, d Flow cytometry analysis of PD-L1+, CD45-PD-L1+ cells (c) and PD-1+ (d) cells in lung tissues of mice exposed to tobacco smoke. PD-1 + cells in lung tissues of mice treated with BaP were also shown (d). PD-1+ cells in this experiment were analyzed from the CD45+CD3+ leukocytes isolated from the same tumor. e The expression of PD-L1 in lung tissues of mice exposed to tobacco smoke was assayed by Western blot. f Lung tissues of BaP-treated mice were isolated and analyzed by IHC assays using an anti-PD-L1 antibody. Scale bar = 2000 μm. g IHC (left and middle panels) and immunofluorescence (right) assays of lung tissues of BaP-treated mice using continuous sections of 5 μm. IHC assay was conducted using anti-TTF1 and anti-PD-L1 antibodies, and immunofluorescence assay was performed using anti-PD-L1 (green) and anti-TTF1 (white) antibodies, and 4,6-diamidino-2-phenylindole (DAPI) to stain the nucleus (blue). IHC assays, scale bar = 2000 μm; immunofluorescence assays, scale bar = 20 μm. h Flow cytometry analysis of PD-L1+ and CD45-PD-L1+ cells in lung tissues of mice treated with BaP. i The expression of PD-L1 in lung tissues of BaP-treated mice was assayed by Western blot. j Micro-CT scanning of lungs of BaP-treated mice with or without anti-PD-L1 antibody. k Comparison of tumors in mice of the two groups. l Hematoxylin-eosin (HE) staining of lung sections from BaP-treated mice with or without PD-L1 blockade. Lesions/mouse are shown in (k). Scale bar = 500 μm. m IHC assays of lung tumor tissues of BaP-treated mice using an anti-PD-L1 antibody. Scale bar = 500 μm. n Flow cytometry analysis of CD45+CD3+CD8+ (CD8+) cells in tumor tissues of mice treated with BaP and anti-PD-L1 antibody. Student’s t test, *P < 0.05; **P < 0.01. Error bars, sd

