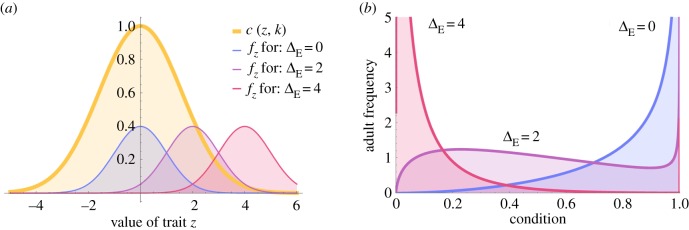
Figure 1.
Effect of environmental change on the probability density function (PDF) of (a) trait z and (b) condition c. In (a), the yellow Gaussian curve represents the relationship between trait value and condition, and PDFs for z are given for three levels of environmental change: ΔE = |μz − z0| = 0 (blue curve), ΔE = 2 (purple curve) and ΔE = 4 (pink curve). In (b), the PDFs for condition c resulting from mapping the three trait distributions in (a) to condition are shown. (Online version in colour.)

