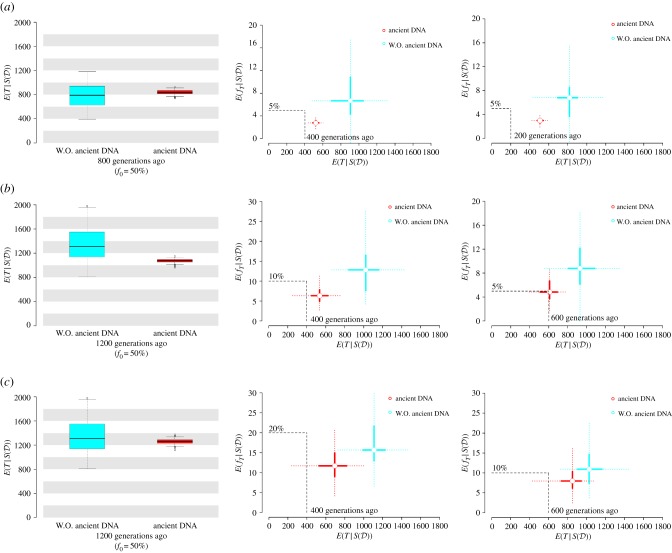
Figure 2.
Comparisons of posterior estimates between kernel ABC with and without (W.O.) ancient DNA data. Tpast is fixed as 400, and (a) , (b) 10% and (c) 20% are tested for different scenarios of the pseudo-observations under the SNM and SSV models (examples of trajectory under the true models are shown in electronic supplementary material, figure S7). Total 100 posterior means are estimated with (red) or without ancient DNA data (light blue). Boxplots represent posterior means of T given under the SNM models with or without ancient DNA data. For the bar plots, points indicate posterior means of T and fT given under the SSV models with (red) or without ancient DNA data (light blue) and thick or dotted lines represent ranges between 25th and 75th quantiles or between 2.5th and 97.5th quantiles of the posterior estimates. The black dashed lines show the values of true parameters. (Online version in colour.)

