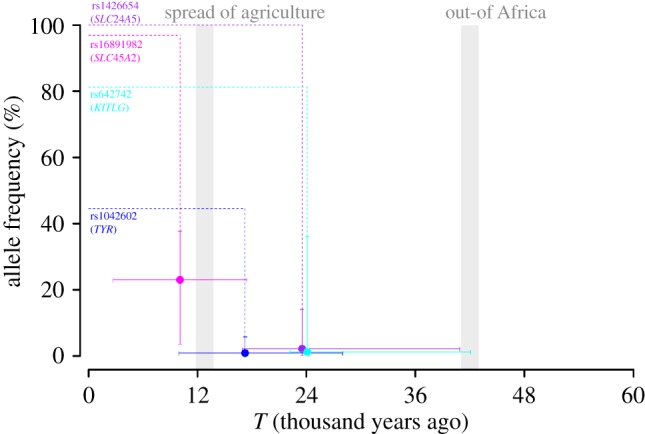
Figure 3.

Posterior estimates of T and fT for four pigmentation SNPs. The parameters are estimated under the best-fitting model shown from the model selection with ancient DNA (table 1). The x-axis represents time, while the y-axis represents allele frequency. The plots show posterior means of T and fT with 95% credible intervals. Dotted lines describe the difference in allele frequency between 0 (i.e. the present) and T. Two major environmental transitions are highlighted with grey shades at 12.8 and 42 ka. (Online version in colour.)
