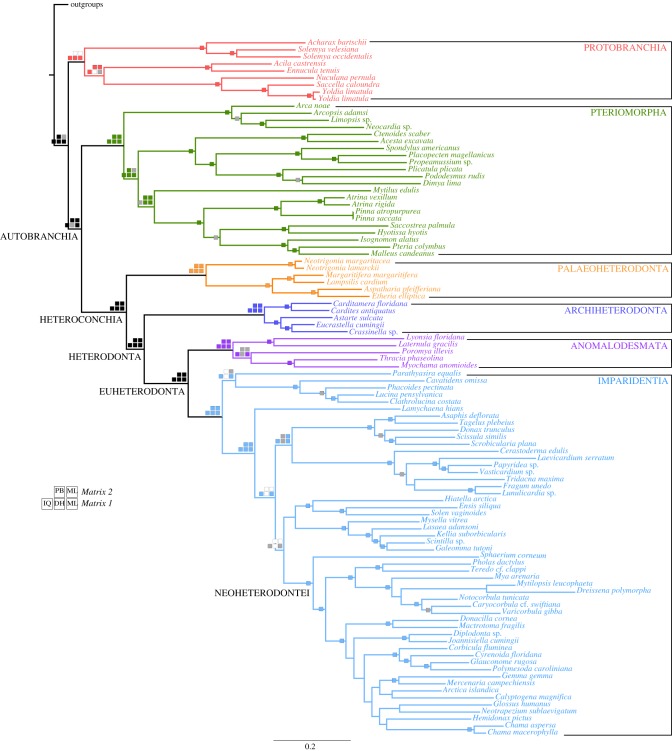
Figure 1.
Phylogenetic hypothesis for Bivalvia based on Matrix 1 analysed in RAxML with support values plotted as follows: checked boards in major deep nodes represent nodal support for the different analyses in Matrix 1 (bottom row) and Matrix 2 (top row). PHYML-PCMA and RAxML are abbreviated as ML, PHYLOBAYES: PB, RAxML with Dayhoff recoding: DH and IQtree: IQ. Filled squares indicate nodal support values higher than 90% bootstraps (ML) and a posterior probability of 0.99 or higher (PB). Grey squares indicate lower nodal support and white squares indicate unrecovered nodes in the specified analysis. Single squares on internal nodes indicate that the node was recovered in all five analyses either with maximum or partial support. Internal nodes not recovered by all five analyses are not reported. Bivalvia subclasses are represented in different shades of colour.

