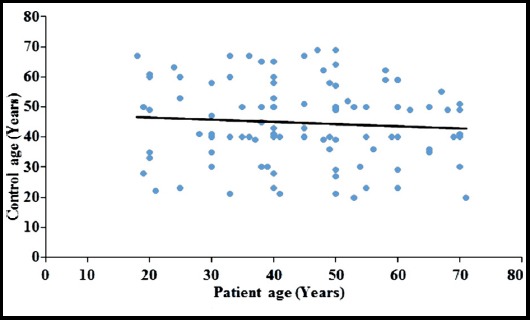
Fig.1.

The scattered diagram shows that patients and healthy age. The trend line of regression is horizontal showing the neutralization of age effect between control and disease groups.

The scattered diagram shows that patients and healthy age. The trend line of regression is horizontal showing the neutralization of age effect between control and disease groups.