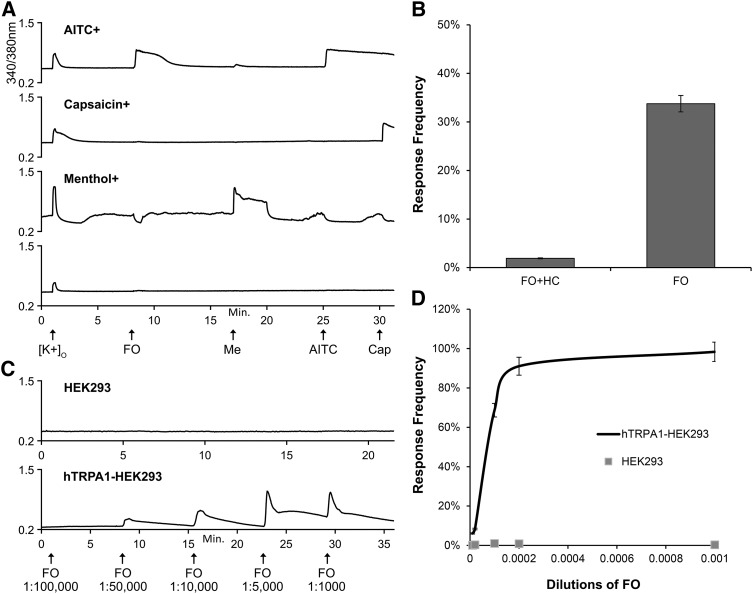
Fig. 1.
FO activates mouse and human TRPA1. (A) Representative calcium imaging traces of neuronal phenotypes observed among 1328 neurons analyzed from DRG cultures of three adult wild-type C57BL/6 mice. The y-axis is the 340/380-nm ratio, a measure of intracellular calcium, and x-axis is the duration of the experiment in minutes. Arrows on x-axis indicate 15-second treatments with each stimulus. AITC, 100 μM allyl isothiocyanate; Cap, 300 nM capsaicin; FO, 1:10,000-fold diluted fennel oil; [K+]o, 30 mM extracellular K+; Me, 400 μM menthol. (B) Response frequency, measured as percentage of cells activated, of FO (1:10,000-fold diluted) responses in presence and absence of 30 μM HC-030031 (HC), a selective TRPA1 antagonist. (C) Representative calcium imaging traces for FO dilutions (x-axis) in normal HEK293 cells (top) and HEK293 cells stably overexpressing human TRPA1 (bottom). (D) Response frequency of FO dilutions in normal (n = 676) and human TRPA1-expressing HEK293 cells (n = 1695).

