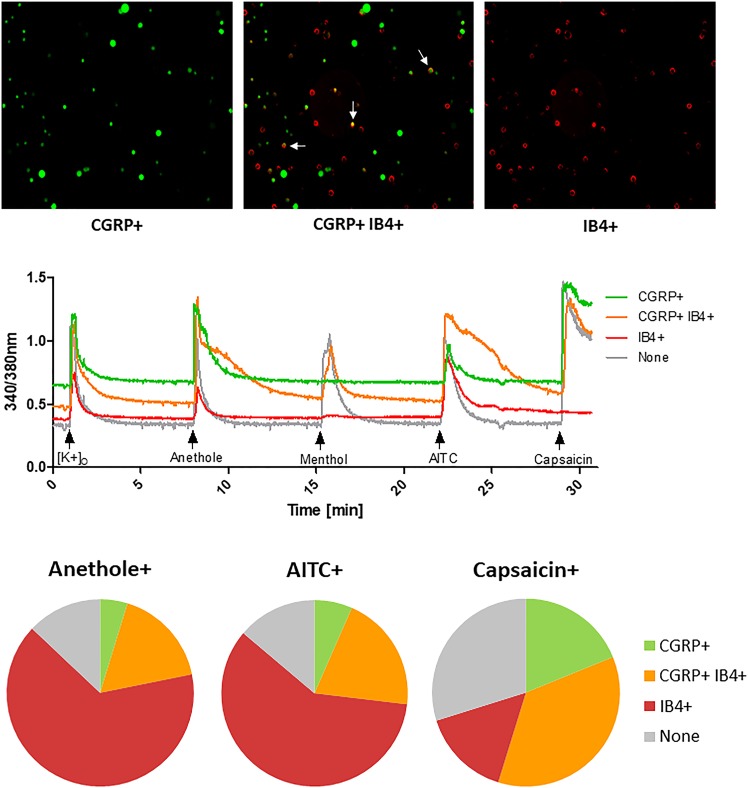
Fig. 3.
Distribution of peptidergic and nonpeptidergic neuronal subtype neurons activated by anethole, AITC, and capsaicin. (Top) Representative images show CGRP+, CGRP+ IB4+ (overlaid images of CGRP+ and IB4+), and IB4+ neurons (from left to right). White arrows point at examples of CGRP+ and IB4+ neurons. (Middle) Representative traces for each neuronal subtype. (Bottom) Pie charts show average distribution of neuronal cell types, i.e., CGRP+ (green), CGRP+ IB4+ (yellow), IB4+ (red), and CGRP− IB4− or none (gray) activated by anethole (n = 504), AITC (n = 731), and capsaicin (n = 945) from DRG cultures of three adult CD-1 mice.

