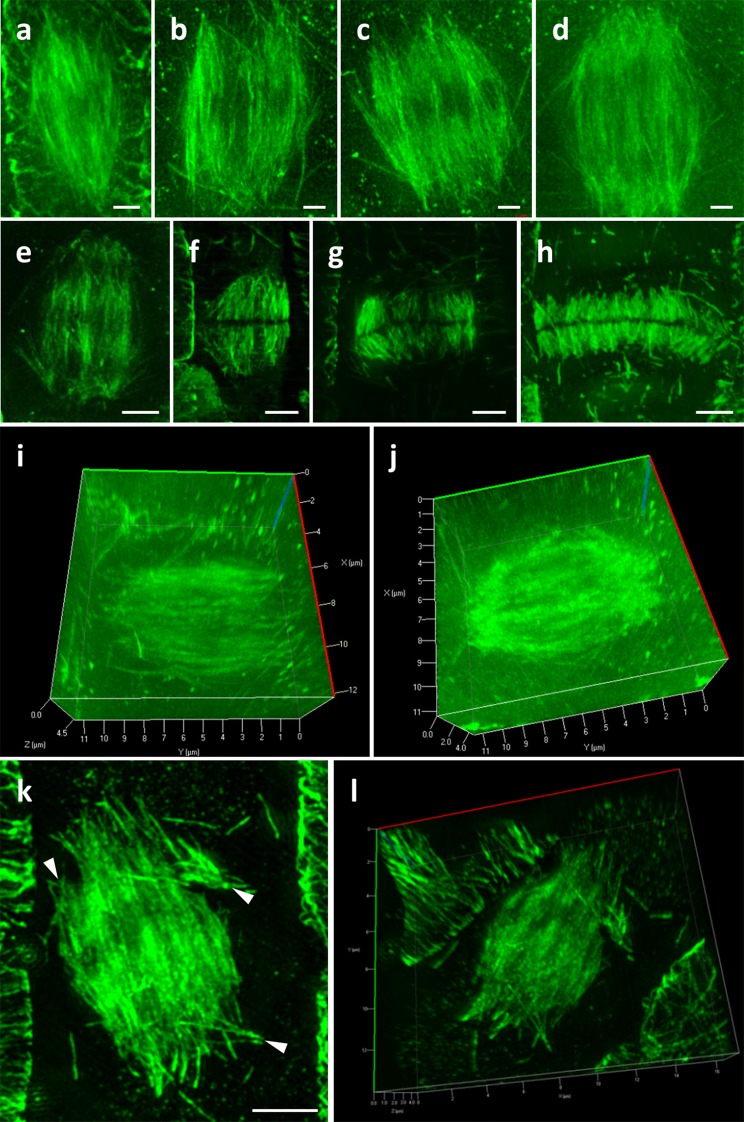
Fig. 3.
Potential of 3D-SIM in visualizing mitotic and cytokinetic microtubule configurations. a Maximum intensity projection of a prophase spindle. b Maximum intensity projection of a prometaphase spindle. c Maximum intensity projection of a metaphase spindle. d Maximum intensity projection of an early anaphase spindle. e Maximum intensity projection of a telophase spindle. f–h Successive stages of centrifugal phragmoplast expansion. i, j Examples of 3D rendering of cells depicted in b and d respectively (see also Additional file 1: Video 1 and Additional file 2: Video 2), showing the potential of SIM to capture the entire volume of the mitotic apparatus. k, l Maximum intensity projection (k) and 3D (l) rendering of an aberrant mitotic spindle of ktn1-2 (see also Additional file 3: Video 3). Arrowheads show ectopic microtubules occurrence (k). Bars in a–h, k, l = 2 μm

