Fig. 8.
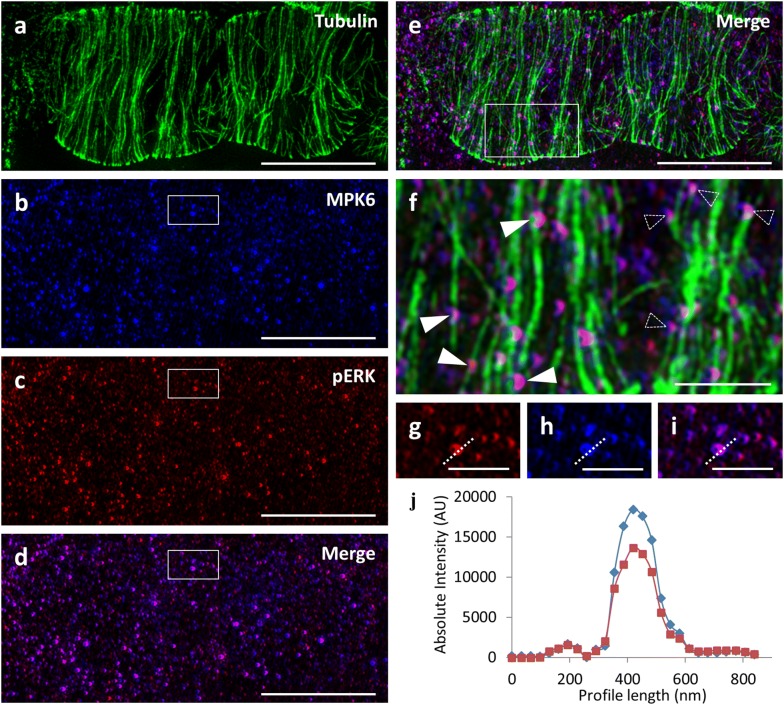
Colocalization of MPK6 and pERK in microtubule bound spots analyzed by SIM. a–e Microtubule (a), MPK6 (b), pERK (c), MPK6-pERK overlay (d) and microtubule-MPK6-pERK overlay (e) in root epidermal cells of Col-0. f Close-up view of the boxed area of e, showing pERK and MPK6-labeled spots associated with the walls (full arrowheads) or the tips (outlined arrowheads) of cortical microtubules. g–i MPK6 (g), pERK (h) and overlay (i) in spots of the outlined area of b–d. j Fluorescence intensity of the profile drawn in g–i, showing absolute coincidence between the signals corresponding to MPK6 and pERK. Bars in a–e = 5 μm; c = 2 μm; g-i = 1 μm

