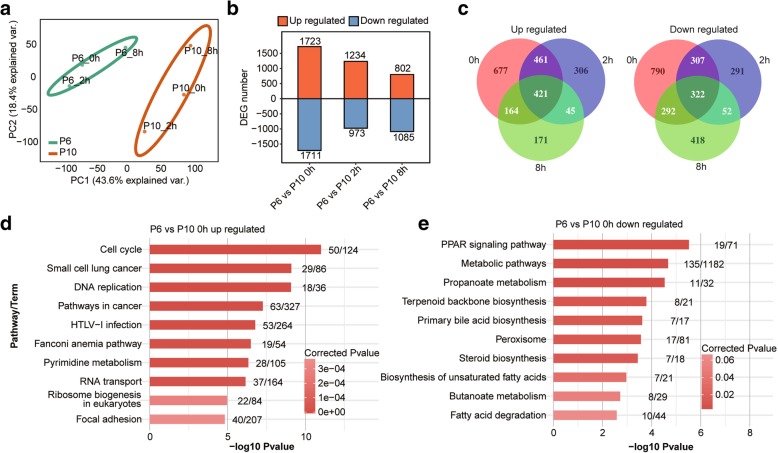
Fig. 2.
BMSC gene expression profiles. a PCA showing clustering by passage, with strong separation of the P6 and P10 BMSCs. b Bar plot illustrating up- and downregulated gene numbers from the P6 versus the P10 data sets. c Venn diagrams for up-(left) and downregulated (right) genes between the P6 and P10 BMSCs that were, both shared and had unique DEG numbers at the three time points. The top10 enriched KEGG pathways for up- (d) and downregulated (e) genes from the P6 versus P10 data sets at 0 h. The numbers after each bar indicate the detected genes (left) and the total background genes involved in the pathway

