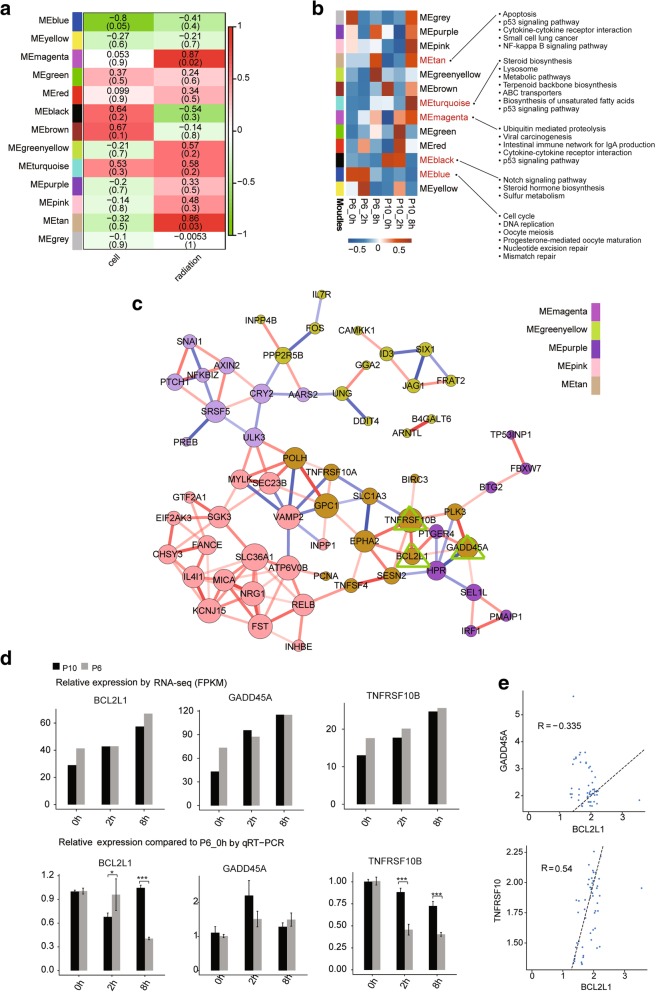
Fig. 5.
Weighted gene co-expression correlation network analysis of the differential expression genes. a Heat map showing the correlations of gene co-expressions modules (colour names) with the cell passage and radiation status. Numbers overlaying the heat map denote Pearson correlation coefficients (top number) and P values (lower number in brackets). Positive (negative) correlations indicate correlation with cell passages or the radiation treatment time background. b Heat map showing eigengene patterns of gene co-expression modules for six samples. The KEGG pathways on the right were significantly enriched for the genes assigned to the corresponding modules. c Sub-network of genes from five different gene co-expression modules. The node size indicates the correlation number. The red line represents positive correlations. The blue line represents negative correlation. d Relative expression levels of BCL2L1, TNFRSF10B and GADD45A measured by RNA-seq (FPKM) (up) and qRT-PCR (down). For qPCR, actin was used as the reference gene, and non-irradiated P6 BMSCs were used as the control groups; e Validation of expression correlations between two genes by qPCR. Data are represented as the mean ± SEM. Student’s t test was performed to compare P6 and P10 BMSCs with significance set at a P value of less than 0.05. *P < 0.05, **P < 0.01

