
Fig. 2.
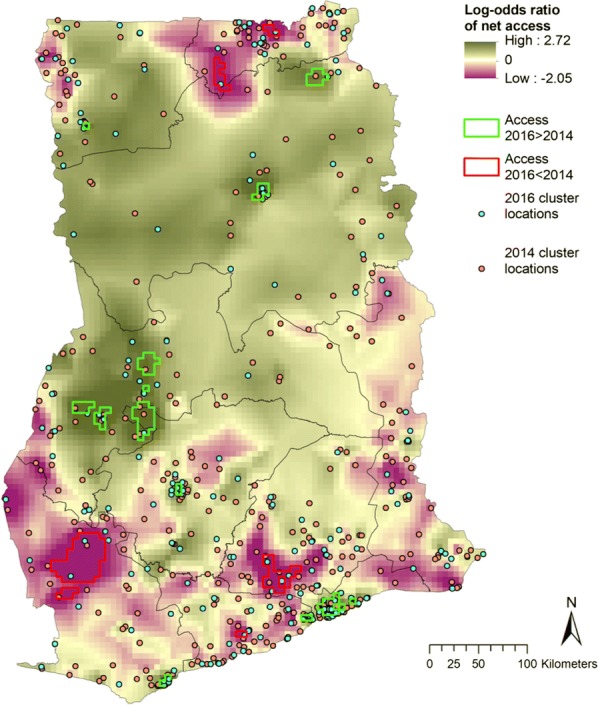
Log odds ratio of NUCA in 2016 relative to 2014. Areas where the lower 95% credible boundary of 2016 was above the upper boundary of 2014 access are demarcated in green, and areas where the lower 95% credible boundary of 2014 access was above the upper boundary of 2016 access are demarcated in red