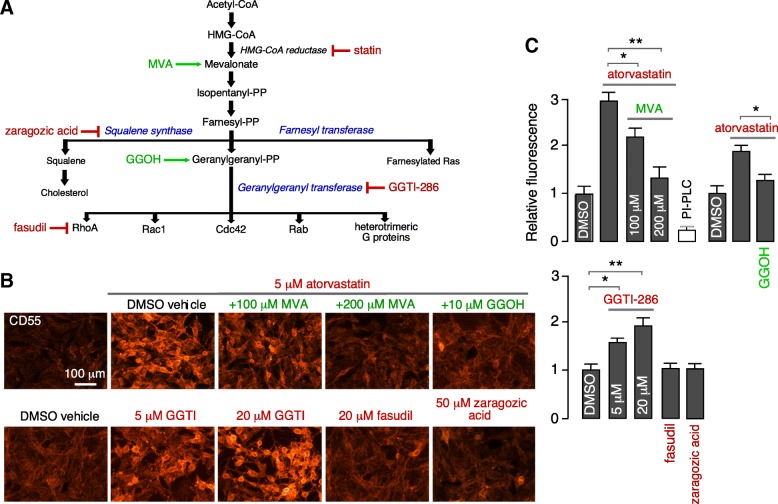
Fig. 5.
Mechanism of CD55 upregulation by atorvastatin. a Schematic of cholesterol biosynthesis pathway and sites of action of indicated agonists and inhibitors. Inhibitors color coded in red and activators in green. b CD55 immunofluorescence in U-251MG cells following 24-h incubation with indicated compounds. c Summary of relative fluorescence (mean ± SEM, n = 7, *P < 0.05, **P < 0.01, unpaired Student’s t test, comparison group as indicated)

