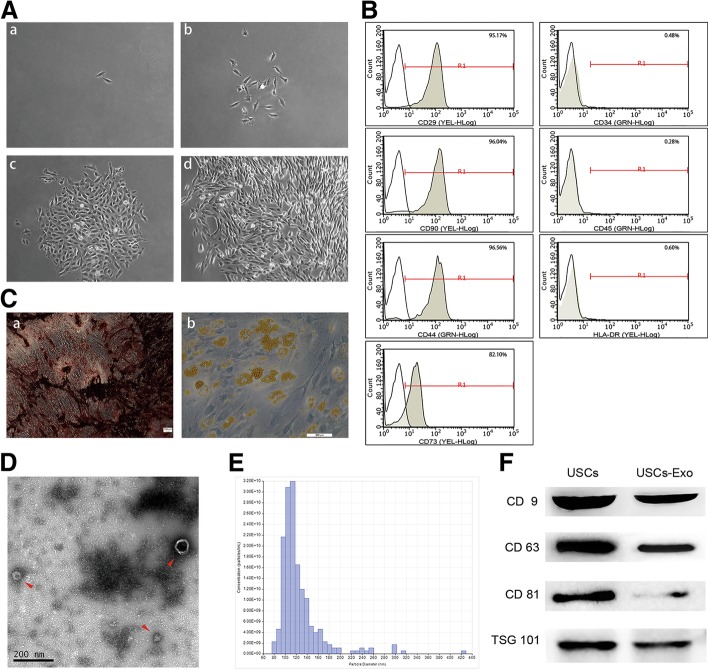
Fig. 1.
Characterization of USCs and USCs-Exo. A Morphology and growth of USCs. B USCs were characterized by FCM using the surface markers CD29, CD90, CD73, CD44, CD34, CD45, and HLA-DR. C USC osteogenic (C-a) and adipogenic (C-b) differentiation. D Morphology of USCs-Exo under a transmission electron microscope (arrowheads). E TRPS measurement showed that the size range of USCs-Exo concentrated at 70–150 nm, and the measured mean concentration (particles/mL) of USCs-Exo was 1.57 × 10¹¹). F Western blot analysis of exosome-specific CD9, CD63, CD81, and TSG101 protein expressions in USCs and USCs-Exo

