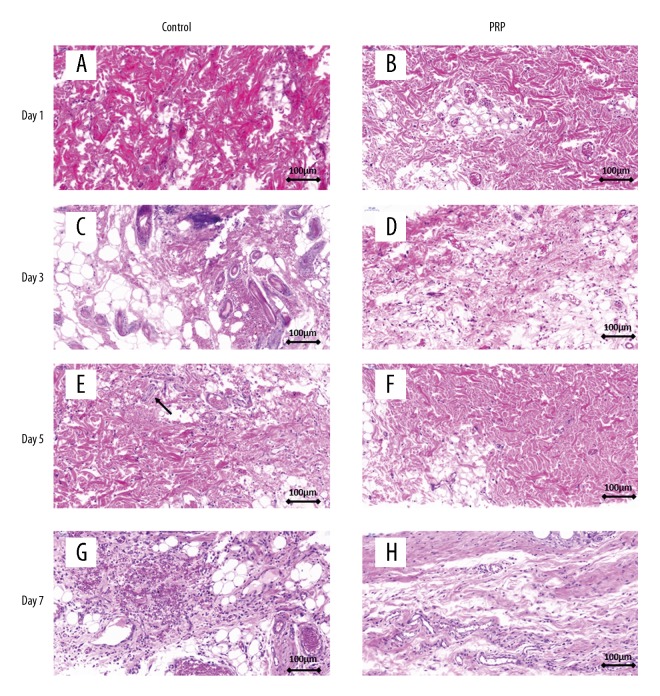
Figure 2.
HE staining of skin flap at various time points. (A, B) The epidermis and the dermis structure were clear and muscle fiber was uniform in the PRP group and control group. (C, D) The PRP group showed less area of granulation tissue and inflammation than in the control group after day 3. (E, F) Muscle fibers in the PRP group were arranged more closely than in the control group after day 5. Locally, muscle fiber was necrosed and dissolved in the control group, accompanied by inflammatory cell infiltration (black arrow). (G, H) There were fewer inflammatory cells in the PRP group than in the control group. More new blood vessels were generated in the PRP group than in the control group.

